

Mathematics, 12.02.2021 09:30, morrowdrew
4
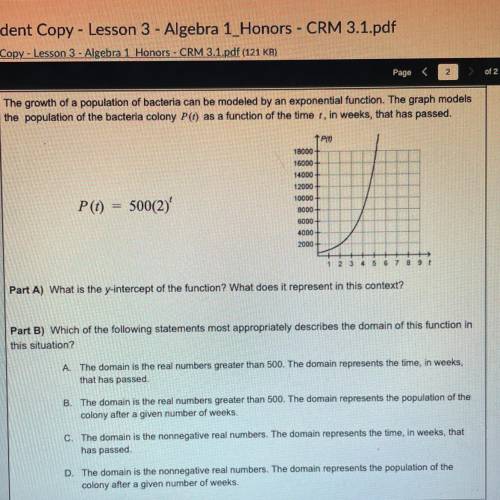
The growth of a population of bacteria can be modeled by an exponential function. The graph models
the population of the bacteria colony Pt) as a function of the time , in weeks, that has passed.
ΤΡΟ
P(t) = 500(2)
18000
16000
14000
12000
10000
8000
6000
4000
2000
1 2 3 4 5 6 7 8 9
Part A) What is the y-intercept of the function? What does it represent in this context?
Part B) Which of the following statements most appropriately describes the domain of this function in
this situation?
A. The domain is the real numbers greater than 500. The domain represents the time, in weeks,
that has passed.
B. The domain is the real numbers greater than 500. The domain represents the population of the
colony after a given number of weeks.
c. The domain is the nonnegative real numbers. The domain represents the time, in weeks, that
has passed.
D. The domain is the nonnegative real numbers. The domain represents the population of the
colony after a given number of weeks.

Answers: 1


Other questions on the subject: Mathematics
Mathematics, 21.06.2019 21:30, elicollierec
What does independent variable and dependent variable mean in math?
Answers: 2
Mathematics, 22.06.2019 03:00, Delgadojacky0206
L2.8.2 test (cst): triangles in the figure, pq is parallel to rs. the length of rp is 5 cm; the length of pt is 30 cm; the length of q7 is 60 cm. what is the length of so? o a. 20 cm 0 0 o b. 6 cm o c. 10 cm od. 2 cm 0 previous
Answers: 2
Mathematics, 22.06.2019 03:30, Sanchezj104
Use a calculator to verify that σ(x) = 62, σ(x2) = 1034, σ(y) = 644, σ(y2) = 93,438, and σ(x y) = 9,622. compute r. (enter a number. round your answer to three decimal places.) as x increases from 3 to 22 months, does the value of r imply that y should tend to increase or decrease? explain your answer. given our value of r, y should tend to increase as x increases. given our value of r, we can not draw any conclusions for the behavior of y as x increases. given our value of r, y should tend to remain constant as x increases. given our value of r, y should tend to decrease as x increases.
Answers: 3
Do you know the correct answer?
4
The growth of a population of bacteria can be modeled by an exponential function. The graph model...
Questions in other subjects:
Mathematics, 24.09.2021 14:00

Mathematics, 24.09.2021 14:00
Mathematics, 24.09.2021 14:00


Mathematics, 24.09.2021 14:00

Biology, 24.09.2021 14:00


