

Mathematics, 12.02.2021 08:20, jlopez113
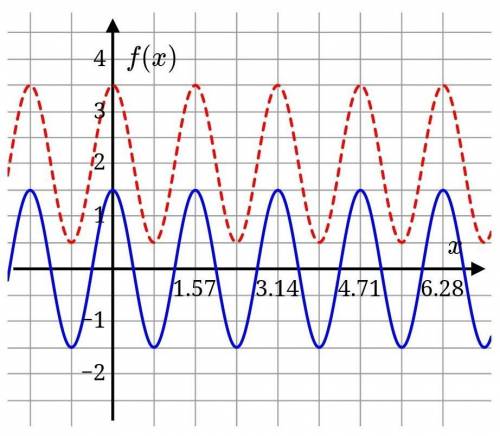
The graphs of two functions, f and g, are shown below.
The solid, blue graph is the graph of f. Write a function formula for f.
f(x)=
The dashed, red graph is the graph of g. Write a function formula for g.
g(x)=

Answers: 3


Other questions on the subject: Mathematics
Mathematics, 21.06.2019 21:20, pampam49
An office supply company conducted a survey before marketing a new paper shredder designed for home use. in the survey, 80 % of the people who tried the shredder were satisfied with it. because of this high satisfaction rate, the company decided to market the new shredder. assume that 80 % of all people are satisfied with this shredder. during a certain month, 100 customers bought this shredder. find the probability that of these 100 customers, the number who are satisfied is 69 or fewer.
Answers: 2
Mathematics, 21.06.2019 23:30, isabel2417
Which equation represents a direct linear variationa. y=x2b. y=2/5xc. y=1/xd. y=x+3
Answers: 3
Do you know the correct answer?
The graphs of two functions, f and g, are shown below.
The solid, blue graph is the graph of f. Wri...
Questions in other subjects:
Mathematics, 30.04.2021 21:20
Mathematics, 30.04.2021 21:20


Physics, 30.04.2021 21:20


