

Mathematics, 12.02.2021 01:50, Svetakotok
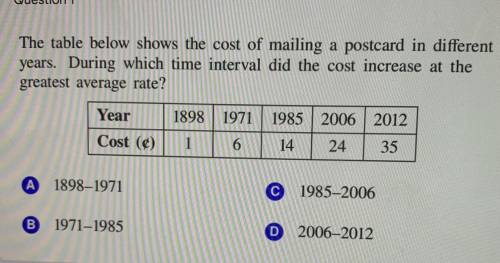
The table below shows the cost of mailing a postcard in different
years. During which time interval did the cost increase at the
greatest average rate?
Year
1898 1971
1985 2006 2012
14 24 35
Cost (€)
1
6
(Α)
1898-1971
C
1985-2006
B
1971-1985
D 2006-2012

Answers: 2


Other questions on the subject: Mathematics
Mathematics, 21.06.2019 17:00, alannismichelle9
The following graph shows the consumer price index (cpi) for a fictional country from 1970 to 1980? a.) 1976 - 1978b.) 1972 - 1974c.) 1974 - 1976d.) 1978 - 1980
Answers: 1
Mathematics, 21.06.2019 20:00, jortizven0001
Seymour is twice as old as cassandra. if 16 is added to cassandra’s age and 16 is subtracted from seymour’s age, their ages become equal. what are their present ages? show !
Answers: 1
Mathematics, 21.06.2019 21:10, Marshmallow6989
Patty made a name tag in the shape of a parallelogram. reilly made a rectangular name tag with the same base and height. explain how the areas of the name tags compare.
Answers: 2
Do you know the correct answer?
The table below shows the cost of mailing a postcard in different
years. During which time interval...
Questions in other subjects:

Mathematics, 16.04.2020 22:08


Biology, 16.04.2020 22:08
Mathematics, 16.04.2020 22:08


