

Mathematics, 11.02.2021 22:20, winstonbendariovvygn
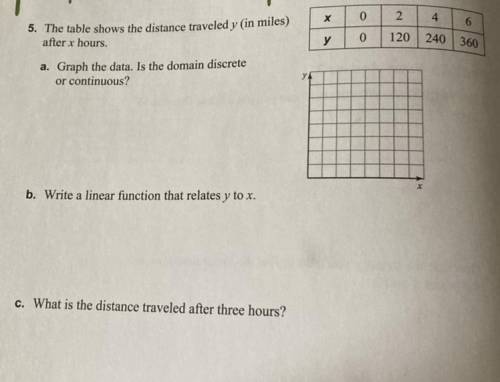
The table shows the distance traveled y (in miles) after x hours.
A. Graph the data. Is the domain discrete or continuous?
B. Write a linear function that relates x to y.
C. What is the distance traveled after three hours?
Use the Picture to find the table.

Answers: 2


Other questions on the subject: Mathematics
Mathematics, 21.06.2019 20:30, Gabyngreen
What is the interquartile range of this data set? 2, 5, 9, 11, 18, 30, 42, 48, 55, 73, 81
Answers: 1
Mathematics, 21.06.2019 22:20, twentyonepilots12018
Which of the following equations are equivalent to -2m - 5m - 8 = 3 + (-7) + m? -15m = -4m -7m - 8 = m - 4 -3m - 8 = 4 - m m - 4 = -7m - 8 -8 - 7m = -4 + m -8 - 3m = 4 - m
Answers: 1
Do you know the correct answer?
The table shows the distance traveled y (in miles) after x hours.
A. Graph the data. Is the domain...
Questions in other subjects:
Mathematics, 13.07.2020 17:01


Biology, 13.07.2020 17:01
Mathematics, 13.07.2020 17:01

History, 13.07.2020 17:01
Mathematics, 13.07.2020 17:01


