Step-by-step explanation:
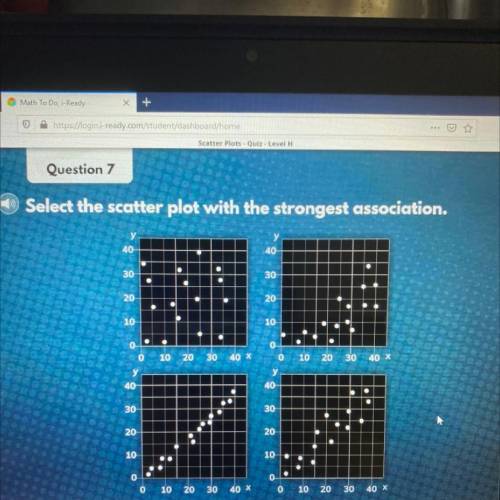
The plot with the points closest to being on the same line will be the plot with the highest correlation, or strongest association.
step-by-step explanation:
.25