

Mathematics, 11.02.2021 15:40, sairaanwar67
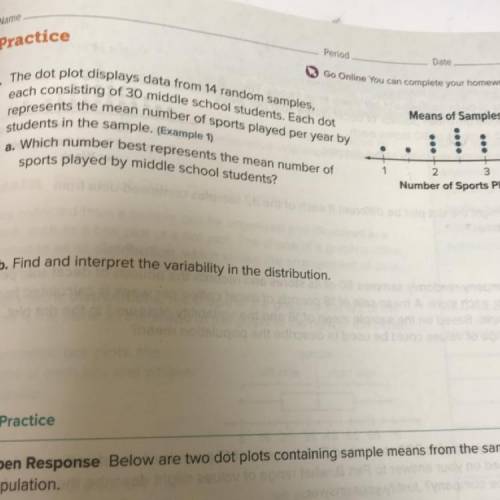
The dot plot displays data from 14 random samples,
each consisting of 30 middle school students. Each dot
represents the mean number of sports played per year by
students in the sample.
a. Which number best represents the mean number of
sports played by middle school students?
Means of Samples
.
4
1
2.
3
Number of Sports Played
b. Find and interpret the variability in the distribution.

Answers: 3


Other questions on the subject: Mathematics
Mathematics, 21.06.2019 22:30, cbkhm
Tommy buys a sweater that is on sale for 40% off the original price. the expression p -0.4p can be used to find the sale price of the sweater, where p is the original price of the sweater. if the original price of the sweater is 50, what is the sale price?
Answers: 1
Do you know the correct answer?
The dot plot displays data from 14 random samples,
each consisting of 30 middle school students. Ea...
Questions in other subjects:
Mathematics, 02.07.2019 00:00

History, 02.07.2019 00:00

Mathematics, 02.07.2019 00:00

Biology, 02.07.2019 00:00

Chemistry, 02.07.2019 00:00

World Languages, 02.07.2019 00:00


