

Mathematics, 11.02.2021 14:00, heatwave9856
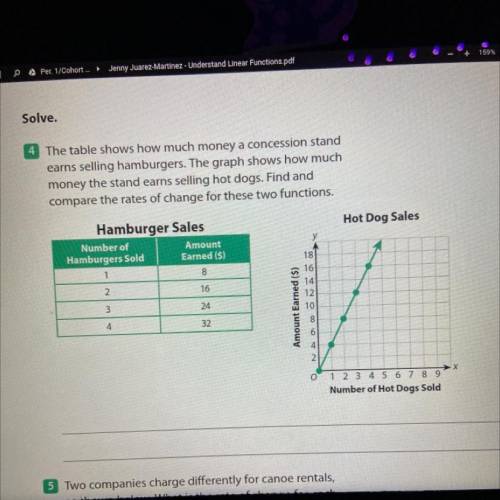
The table shows how much money a concession stand
ears selling hamburgers. The graph shows how much
money the stand earns selling hot dogs. Find and
compare the rates of change for these two functions.
Hot Dog
Hamburger Sales
Number of
Amount
Hamburgers Sold Earned ($)
1
16
3
Eamed (5)
24

Answers: 1


Other questions on the subject: Mathematics
Mathematics, 21.06.2019 19:30, gyliahicks
Jada has a meal in a restaurant she adds up the prices listed on the menu for everything they ordered and gets a subtotal of $42.00. after tax the total is 45.99. what percentage of the subtotal is the total?
Answers: 2
Do you know the correct answer?
The table shows how much money a concession stand
ears selling hamburgers. The graph shows how much...
Questions in other subjects:
Mathematics, 24.06.2019 08:40


English, 24.06.2019 08:40

Social Studies, 24.06.2019 08:40
Mathematics, 24.06.2019 08:40


