

Mathematics, 11.02.2021 14:00, ja815792
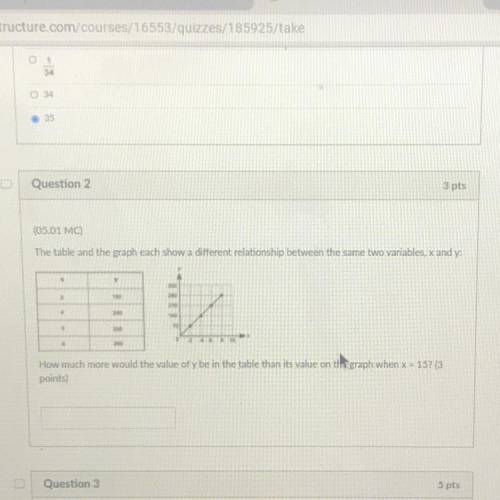
The table and the graph each show a different relationship between the same two variables, x and y
How much more would the value of y be in the table than its value on tigraph when x = 152 (3
points)

Answers: 3


Other questions on the subject: Mathematics
Mathematics, 22.06.2019 02:00, amberwilliams22
The table shows values for functions f(x) and g(x) . x f(x)=−4x−3 g(x)=−3x+1+2 −3 9 179 −2 5 53 −1 1 1 0 −3 −1 1 −7 −7 2 −11 −25 3 −15 −79 what is the solution to f(x)=g(x) ? select each correct answer.
Answers: 1
Do you know the correct answer?
The table and the graph each show a different relationship between the same two variables, x and y...
Questions in other subjects:


Geography, 02.12.2020 03:00

History, 02.12.2020 03:00


English, 02.12.2020 03:00
Mathematics, 02.12.2020 03:00


