

Mathematics, 10.02.2021 23:10, zitterkoph
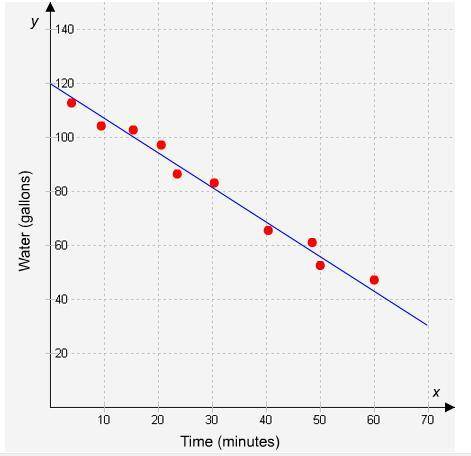
The scatter plot shows the amount of water in a tank as measured every few minutes.
The initial amount of water in the tank was ___
gallons. The line of best fit shows that about ___
gallon(s) of water were lost per minute. The tank will be empty in about ___
minutes.

Answers: 3


Other questions on the subject: Mathematics
Mathematics, 21.06.2019 17:00, averyeverdeen01
Pam buys a sleeve of ball bearings for her skateboard. each of the bearings is 1 1/5 inches wide. the sleeve is 9 3/5 inches long. how many ball bearings are in the sleeve? show your work.
Answers: 3
Mathematics, 21.06.2019 18:30, jakobrobinette
Is the square root of 4 plus the square root of 16 rational?
Answers: 2
Mathematics, 21.06.2019 20:30, catcatscats122
Write two point-slope equations for the line passing through the points (6, 5) and (3, 1)
Answers: 1
Do you know the correct answer?
The scatter plot shows the amount of water in a tank as measured every few minutes.
The initial amo...
Questions in other subjects:
Mathematics, 17.03.2020 17:27


