

Mathematics, 10.02.2021 22:30, famouzgal
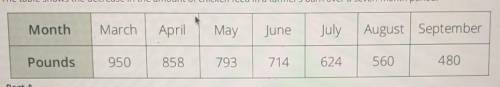
The table shows the decrease in the amount of chicken feed in a farmer's barn over a seven-month period. Let x represent the number of months since March. Write a linear regression equation for the data. Explain what does the linear regression equation for the data represents in the problem situation.

Answers: 2


Other questions on the subject: Mathematics
Mathematics, 21.06.2019 19:30, iloading5117
Carlos spent 1 1/4 hours doing his math homework he spent 1/4 of his time practicing his multiplication facts how many hours to carlos been practicing his multiplication facts
Answers: 2
Mathematics, 21.06.2019 23:00, lizbethmillanvazquez
Apackage of orgainc strwberries costs $1.50 while there in season and $2.25 when not in season what the percent increase
Answers: 1
Mathematics, 22.06.2019 00:30, trinityhayes347
Javier bought a painting for $150. each year, the painting's value increases by a factor of 1.15. which expression gives the painting's value after 77 years?
Answers: 2
Mathematics, 22.06.2019 01:30, wendelljo61
David is standing on the sixth rung of a ladder while painting his house. which expressions represent a change in david’s position of 2 rungs on the ladder? choose exactly two answers that are correct. a. 6+2 b. 6-2 c. 2x6 d. 6/2
Answers: 1
Do you know the correct answer?
The table shows the decrease in the amount of chicken feed in a farmer's barn over a seven-month per...
Questions in other subjects:


Health, 20.10.2020 19:01


Biology, 20.10.2020 19:01
Mathematics, 20.10.2020 19:01
Mathematics, 20.10.2020 19:01
Mathematics, 20.10.2020 19:01


