

Mathematics, 10.02.2021 18:20, taylor3865
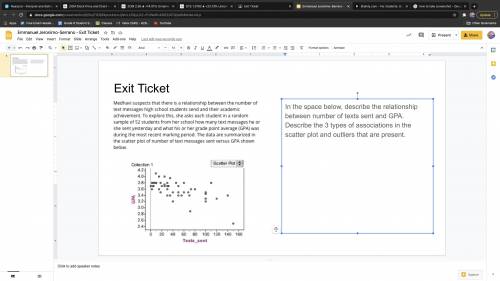
In the space below, describe the relationship between number of texts sent and GPA. Describe the 3 types of associations in the scatter plot and outliers that are present.

Answers: 3


Other questions on the subject: Mathematics
Mathematics, 21.06.2019 23:00, fortnite83
Events a and b are independent. the probability of a occurring is 2/5. the probability of b occurring is 1/4. what is p(a and b)?
Answers: 2
Mathematics, 22.06.2019 00:00, brandon1748
Ascientist studied a population of workers to determine whether verbal praise and/or tangible rewards affect employee productivity. in the study, some workers were offered verbal praise, some were offered tangible rewards (gift cards, presents, and some were offered neither. the productivity of each participant was measured throughout the study by recording the number of daily tasks completed by each employee. which inference might the scientists make based on the given information? a.) the number of daily tasks completed by each employee may influence the dependent variable, which is whether the employee receives verbal praise, tangible rewards, or neither. b.) verbal praise and/or tangible rewards may influence the independent variable, which is the number of daily tasks completed by each employee. c.) verbal praise and/or tangible rewards may influence the dependent variable, which is the number of daily tasks completed by each employee. d.) the dependent variables, which are verbal praise and tangible rewards, may influence the number of daily tasks completed by each employee.
Answers: 1
Mathematics, 22.06.2019 03:00, TheOriginalMeyah
The biologist has a second culture to examine. she knows that the population of the culture doubles every 15 minutes. after 1 hour and 15 minutes, her assistant found that 80,000 bacteria were present. a) what was the size of the initial population? b) predict the size of the culture at t=3 hours. what was the size of the population at 40 minutes? explain and justify your answers. c) create a graph of the population as a function of time. find an equation that can be used to predict the size of the population at any time t. d) examine the rate at which the bacteria culture is growing. how fast is the culture growing after 1 hour? after 1.5 hours? after 2 hours? use a time interval of h = 0.01 hours to estimate these rates. interpret these rates in terms of the context of the problem situation. how do these three rates compare?
Answers: 1
Do you know the correct answer?
In the space below, describe the relationship between number of texts sent and GPA. Describe the 3 t...
Questions in other subjects:

Law, 16.06.2021 22:30

English, 16.06.2021 22:30
Mathematics, 16.06.2021 22:30

History, 16.06.2021 22:30
English, 16.06.2021 22:30
Mathematics, 16.06.2021 22:30
History, 16.06.2021 22:30
History, 16.06.2021 22:30
Mathematics, 16.06.2021 22:30


