


Rovw
Unit 3 Tost of
The graph below represents the height of a soccer ball, h, in feet as a f...

Mathematics, 10.02.2021 15:30, reesestarretttt
Rovw
Unit 3 Tost of
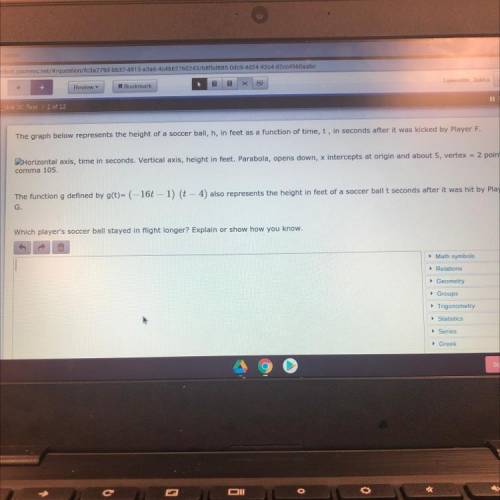
The graph below represents the height of a soccer ball, h, in feet as a function of time, t, in seconds after it was
Horizontal axis, time in seconds. Vertical axis, height in feet, Parabola, opens down, x intercepts at origin and
comma 105
The function defined by g(t)= (-161 – 1) (t - 4) also represents the height in feet of a soccer ball t second
Which player's soccer ball stayed in flight longer? Explain or show how you know

Answers: 2
Other questions on the subject: Mathematics
Mathematics, 21.06.2019 18:10, kingbob101
Drag the tiles to the boxes to form correct pairs. not all tiles will be used. match each set of vertices with the type of quadrilateral they form.
Answers: 1
Mathematics, 21.06.2019 21:30, ajm1132005
Questions 9-10. use the table of educational expenditures to answer the questions. k-12 education expenditures population indiana $9.97 billion 6.6 million illinois $28.54 billion 12.9 million kentucky $6.58 billion 4.4 million michigan $16.85 billion 9.9 million ohio $20.23 billion 11.6million 9. if the amount of k-12 education expenses in indiana were proportional to those in ohio, what would have been the expected value of k-12 expenditures in indiana? (give the answer in billions rounded to the nearest hundredth) 10. use the value of k-12 education expenditures in michigan as a proportion of the population in michigan to estimate what the value of k-12 education expenses would be in illinois. a) find the expected value of k-12 expenditures in illinois if illinois were proportional to michigan. (give the answer in billions rounded to the nearest hundredth) b) how does this compare to the actual value for k-12 expenditures in illinois? (lower, higher, same? )
Answers: 1
Mathematics, 21.06.2019 22:10, Kurlyash
Atype of plant is introduced into an ecosystem and quickly begins to take over. a scientist counts the number of plants after mmonths and develops the equation p(m)= 19.3(1.089)^m to model the situation. most recently, the scientist counted 138 plants. assuming there are no limiting factors to the growth of the plants, about how many months have passed since the plants werefirst introduced? a)o 6.1b)0.6.6c)10 72d)o 23.1
Answers: 3
Mathematics, 21.06.2019 23:30, fonzocoronado3478
Answer each of the questions for the following diagram: 1. what type of angles are these? 2. solve for x. what does x equal? 3. what is the measure of the angles?
Answers: 1
Do you know the correct answer?
Questions in other subjects:


History, 07.10.2020 14:01
Mathematics, 07.10.2020 14:01


Mathematics, 07.10.2020 14:01

Mathematics, 07.10.2020 14:01


