


1 point
2. The set of graphed points shown represents a function. Which point
could be added...

Mathematics, 09.02.2021 18:30, dpazmembreno
1 point
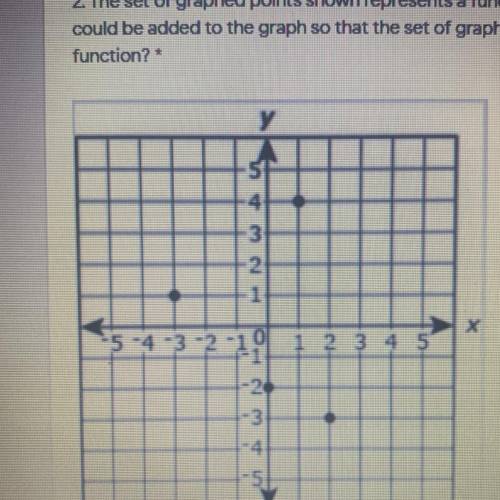
2. The set of graphed points shown represents a function. Which point
could be added to the graph so that the set of graphed points remains a
function?
y
5
4
3
2
1
-5 -4 -3
-10
1 2 3 4 5
-20
-3
-4
-5
0 0.2
(-2.1
O O O O
(-3.2
(15)

Answers: 2
Other questions on the subject: Mathematics
Mathematics, 21.06.2019 18:30, mikey8510
The median of a data set is the measure of center that is found by adding the data values and dividing the total by the number of data values that is the value that occurs with the greatest frequency that is the value midway between the maximum and minimum values in the original data set that is the middle value when the original data values are arranged in order of increasing (or decreasing) magnitude
Answers: 3
Mathematics, 21.06.2019 18:30, nikidastevens36
Idon’t understand! use slope intercept form to solve: through: (2,5) slope= undefined
Answers: 1
Mathematics, 21.06.2019 20:00, oofoofoof1
Fred has a spinner that is split into four equal sections: red, blue, green, and yellow. fred spun the spinner 688 times. which of the following would be a good estimate of the number of times the spinner lands on the green section? a. 269 b. 603 c. 344 d. 189
Answers: 1
Mathematics, 21.06.2019 21:30, kameronstebbins
High school seniors with strong academic records apply to the nation’s most selective colleges in greater numbers each year. because the number of slots remains relatively stable, some colleges reject more early applicants. suppose that for a recent admissions class, an ivy league college received 2851 applications for early admission. of this group, it admitted 1033 students early, rejected 854 outright, and deferred 964 to the regular admission pool for further consideration. in the past, this school has admitted 18% of the deferred early admission applicants during the regular admission process. counting the students admitted early and the students admitted during the regular admission process, the total class size was 2375. let e, r, and d represent the events that a student who applies for early admission is admitted early, rejected outright, or deferred to the regular admissions pool. suppose a student applies for early admission. what is the probability that the student will be admitted for early admission or be deferred and later admitted during the regular admission process?
Answers: 3
Do you know the correct answer?
Questions in other subjects:

Social Studies, 12.02.2020 03:17


Law, 12.02.2020 03:17


Mathematics, 12.02.2020 03:17
Mathematics, 12.02.2020 03:17
Mathematics, 12.02.2020 03:17


