


Please help!
The illustration below shows the graph of y as a function of x.
Complete the fol...

Mathematics, 09.02.2021 01:00, raiindrxp
Please help!
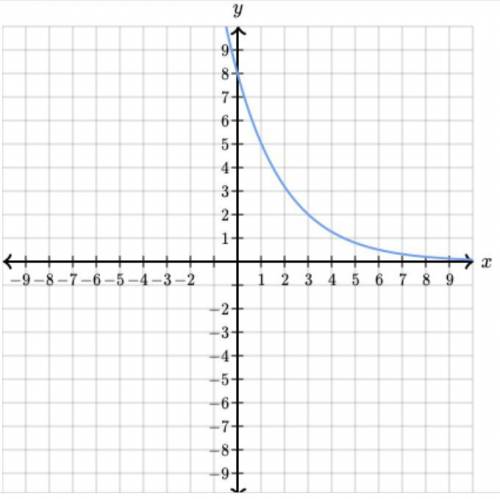
The illustration below shows the graph of y as a function of x.
Complete the following sentences based on the graph of the function.
- As x increases, y _ (increases/decreases).
- The rate of change for y as a function of x is not _ (constant/constant), therefore the function is _ (linear/nonlinear).
- For all values of x, the function value y ___ (≤/≥/=) 0.
- The y-intercept of the graph is the function value y = _.
- When x = 1, the function value y = ___.

Answers: 2
Other questions on the subject: Mathematics
Mathematics, 21.06.2019 22:00, 1xXJOKERXx3
Rewrite 9 log, x2 in a form that does not use exponents. 9log, x = log, x
Answers: 3
Mathematics, 21.06.2019 22:40, winterblanco
Use this graph to find the cost of 6 show tickets
Answers: 1
Mathematics, 22.06.2019 00:30, Queenashley3232
What is the perimeter of a rectangle if the length is 5 and the width is x?
Answers: 3
Do you know the correct answer?
Questions in other subjects:


Mathematics, 19.08.2020 22:01


