

Mathematics, 06.02.2021 01:00, cratsley321
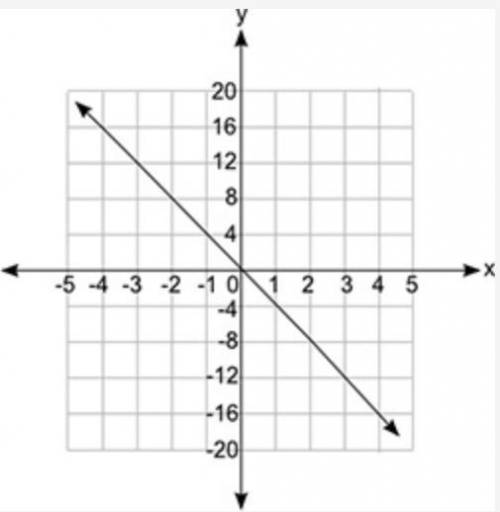
Which equation does the graph below represent?
A coordinate grid is shown. The x axis values are from negative 5 to positive 5 in increments of 1 for each grid line, and the y axis values are from negative 20 to positive 20 in increments of 4 for each grid line. A line is shown passing through the ordered pairs negative 4, 16 and 0, 0 and 4, negative 16.
y = fraction 1 over 4x
y = 4x
y = fraction negative 1 over 4x
y = −4x

Answers: 1


Other questions on the subject: Mathematics
Mathematics, 21.06.2019 17:00, jadejordan8888
What properties allow transformation to be used as a problem solving tool
Answers: 1
Mathematics, 21.06.2019 18:30, rocksquad9125
Ricky takes out a $31,800 student loan to pay his expenses while he is in college. after graduation, he will begin making payments of $190.66 per month for the next 30 years to pay off the loan. how much more will ricky end up paying for the loan than the original value of $31,800? ricky will end up paying $ more than he borrowed to pay off the loan.
Answers: 1
Mathematics, 21.06.2019 20:00, angelisabeast5430
Rectangle bcde is similar to rectangle vwxy. what is the length of side vy? a) 1 7 b) 2 7 c) 3 7 d) 4 7
Answers: 3
Do you know the correct answer?
Which equation does the graph below represent?
A coordinate grid is shown. The x axis values are fr...
Questions in other subjects:


Social Studies, 19.07.2019 06:30

Mathematics, 19.07.2019 06:30


