

Mathematics, 05.02.2021 21:20, tjkma1234
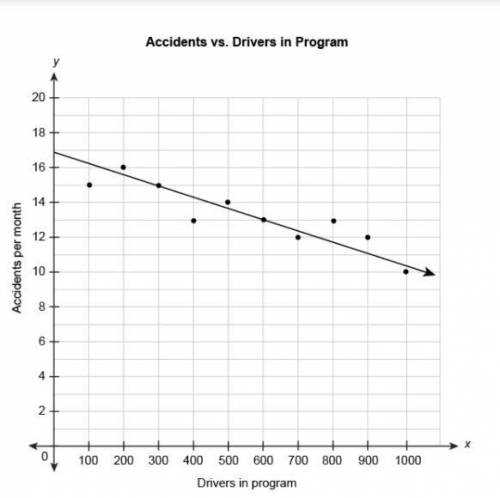
The scatter plot shows the relationship between the number of car accidents in a month and the number of drivers attending a program on distracted driving. The equation represents the linear model for this data.
y=−0.0067x+17
What does the number -0.0067 in the equation mean in this context?
The number of accidents increased by 0.67 per month for every additional 100 drivers in the program.
There were 0.67 accidents per month.
The number of accidents was reduced by 0.67 per month for every additional 100 drivers in the program.
The number of accidents was reduced by 0.67 per month for every additional driver in the program.
The number of accidents was reduced by 0.67 per month every month.

Answers: 1


Other questions on the subject: Mathematics
Mathematics, 22.06.2019 02:30, nawafcanada
The graph shows the amount of total rainfall at each hour what was the total rainfall amount after three hours
Answers: 1
Mathematics, 22.06.2019 03:00, Alizerodriguez2010
Rectangle abcd is similar to rectangle rstu . what is the scale factor of a dilation from abcd to rstu ? enter your answer in the box.
Answers: 2
Do you know the correct answer?
The scatter plot shows the relationship between the number of car accidents in a month and the numbe...
Questions in other subjects:
Mathematics, 18.09.2021 07:10

Mathematics, 18.09.2021 07:10
Mathematics, 18.09.2021 07:10
Mathematics, 18.09.2021 07:10

Law, 18.09.2021 07:10


