

Mathematics, 05.02.2021 21:10, katy1110
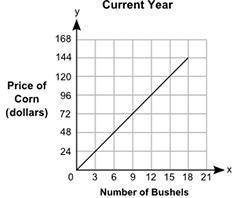
The graph shows the prices of different numbers of bushels of corn at a store in the current year. The table shows the prices of different numbers of bushels of corn at the same store in the previous year.
A graph shows Number of Bushels on x-axis and Price of Corn in dollars on y-axis. The x-axis scale is shown from 0 to 21 at increments of 3, and the y-axis scale is shown from 0 to 168 at increments of 24. A straight line joins the ordered pairs 3, 24 and 6, 48 and 9, 72 and 12, 96 and 15, 120 and 18, 144.
Previous Year
Number of Bushels Price of Corn (dollars)
3 21
6 42
9 63
12 84
Part A: Describe in words how you can find the rate of change of a bushel of corn in the current year, and find the value. (5 points)
Part B: How many dollars more is the price of a bushel of corn in the current year than the price of a bushel of corn in the previous year? Show your work. (5 points)

Answers: 3


Other questions on the subject: Mathematics
Mathematics, 21.06.2019 16:30, jessica01479
Scale factor of 2 is used to enlarge a figure as shown below the area of is 18 in.²
Answers: 3
Mathematics, 21.06.2019 21:00, batmanmarie2004
The functions below show the amount of money bella and sweet t had saved after earning money for doing chores. which description best compares the two functions?
Answers: 1
Do you know the correct answer?
The graph shows the prices of different numbers of bushels of corn at a store in the current year. T...
Questions in other subjects:


English, 19.06.2020 09:57
English, 19.06.2020 09:57
English, 19.06.2020 09:57


