

Mathematics, 05.02.2021 03:20, Jennifer312332
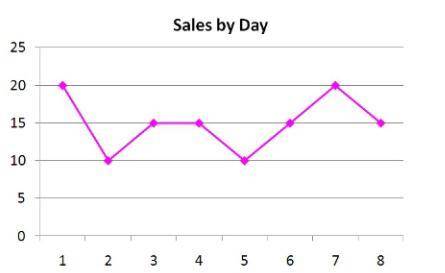
Is the graph below misleading? If so, choose the best reason why. A. The y-axis is scaled too big or too small, or the y-axis does not start at 0. B. The x-axis is scaled too big or too small, or the x-axis skips numbers or omits data. C. The axes are not properly labeled or are incompletely labeled. D. The graph is not misleading.

Answers: 1


Other questions on the subject: Mathematics
Mathematics, 21.06.2019 20:00, Chen5968
The distribution of the amount of money spent by students for textbooks in a semester is approximately normal in shape with a mean of $235 and a standard deviation of $20. according to the standard deviation rule, how much did almost all (99.7%) of the students spend on textbooks in a semester?
Answers: 2
Mathematics, 21.06.2019 20:30, ElegantEmerald
A. plot the data for the functions f(x) and g(x) on a grid and connect the points. x -2 -1 0 1 2 f(x) 1/9 1/3 1 3 9 x -2 -1 0 1 2 g(x) -4 -2 0 2 4 b. which function could be described as exponential and which as linear? explain. c. if the functions continue with the same pattern, will the function values ever be equal? if so, give estimates for the value of x that will make the function values equals. if not, explain why the function values will never be equal.
Answers: 3
Mathematics, 21.06.2019 22:00, Thejollyhellhound20
The sum of the speeds of two trains is 720.2 mph. if the speed of the first train is 7.8 mph faster than the second train, find the speeds of each.
Answers: 1
Mathematics, 22.06.2019 01:30, deonharris18
Henry's butcher shop uses an electronic scale that measures to 1/100 of a pound. which is the most accurate measurement based on the limitations of the scale that might be found on a package of meat sold by henry?
Answers: 2
Do you know the correct answer?
Is the graph below misleading? If so, choose the best reason why. A. The y-axis is scaled too big or...
Questions in other subjects:


History, 04.04.2020 10:50


English, 04.04.2020 10:51


