Mathematics, 04.02.2021 23:30, mckennayoshz
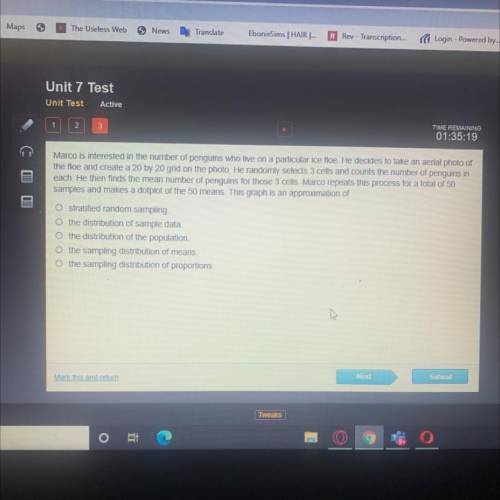
Marco is interested in the number of penguins who live on a particular ice floe. He decides to take an aerial photo of
the floe and create a 20 by 20 grid on the photo. He randomly selects 3 cells and counts the number of penguins in
each. He then finds the mean number of penguins for those 3 cells. Marco repeats this process for a total of 50
samples and makes a dotplot of the 50 means. This graph is an approximation of
O stratified random sampling.
the distribution of sample data.
the distribution of the population.
the sampling distribution of means.
the sampling distribution of proportions,
M


Answers: 1
Other questions on the subject: Mathematics


Mathematics, 21.06.2019 16:30, emilyanneK2540
Jackie purchased 3 bottles of water and 2 cups of coffee for a family for $7.35. brian bought 4 bottles of water and 1 cup of coffee for his family for $7.15. how much does each bottle of water cost? how much does each cup of coffee cost? i need this done
Answers: 3


Mathematics, 21.06.2019 22:50, alisonlebron15
What is the ordered pair of m’ after point m (5, 6) is rotated 90° counterclockwise?
Answers: 2
Do you know the correct answer?
Marco is interested in the number of penguins who live on a particular ice floe. He decides to take...
Questions in other subjects:

Mathematics, 13.11.2021 06:30

English, 13.11.2021 06:30


Chemistry, 13.11.2021 06:30


Physics, 13.11.2021 06:30

Computers and Technology, 13.11.2021 06:30


