


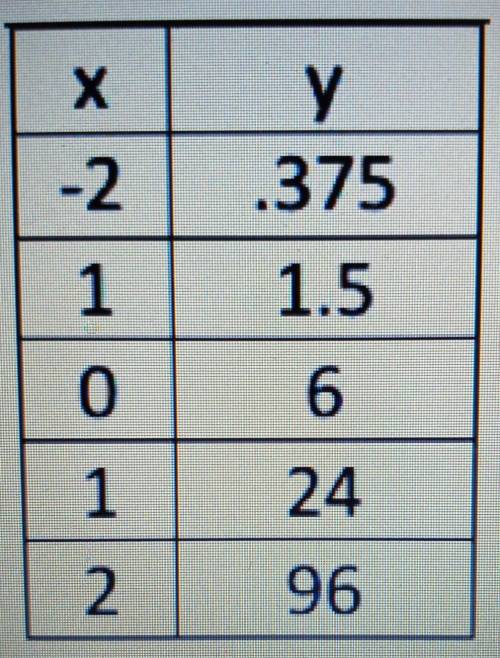
Given the table below:
Is it a growth or decay function?
Write the equation to represent the f...

Mathematics, 04.02.2021 22:30, haleysnyder6464
Given the table below:
Is it a growth or decay function?
Write the equation to represent the function.

Answers: 3
Other questions on the subject: Mathematics
Mathematics, 21.06.2019 19:00, ashrobbb
The annual snowfall in a town has a mean of 38 inches and a standard deviation of 10 inches. last year there were 63 inches of snow. find the number of standard deviations from the mean that is, rounded to two decimal places. 0.44 standard deviations below the mean 2.50 standard deviations below the mean 0.44 standard deviations above the mean 2.50 standard deviations above the mean
Answers: 3
Mathematics, 21.06.2019 21:00, lunnar2003
Graph the system of inequalities presented here on your own paper, then use your graph to answer the following questions: y < 4x − 8 y is greater than or equal to negative 5 over 2 times x plus 5 part a: describe the graph of the system, including shading and the types of lines graphed. provide a description of the solution area. (6 points) part b: is the point (5, −8) included in the solution area for the system? justify your answer mathematically. (4 points)
Answers: 3
Do you know the correct answer?
Questions in other subjects:


Biology, 20.09.2020 01:01

History, 20.09.2020 01:01
Biology, 20.09.2020 01:01
Mathematics, 20.09.2020 01:01
Mathematics, 20.09.2020 01:01


