Mathematics, 04.02.2021 22:00, gaboalejandro833
Can somebody please help me? I will give brainliest
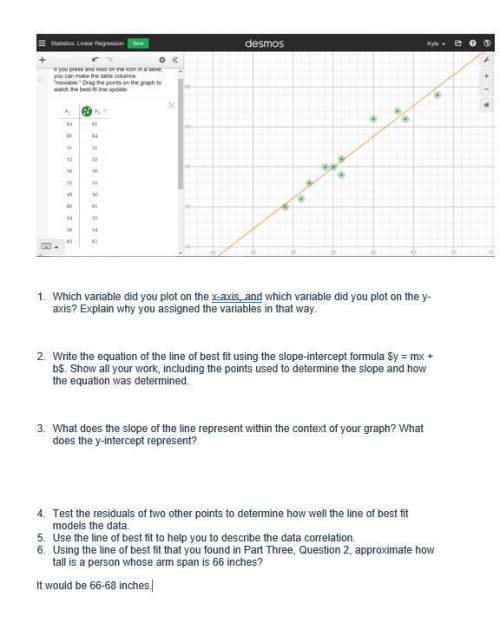
1. Which variable did you plot on the x-axis, and which variable did you plot on the y-axis? Explain why you assigned the variables in that way.
2. Write the equation of the line of best fit using the slope-intercept formula $y = mx + b$. Show all your work, including the points used to determine the slope and how the equation was determined.
3. What does the slope of the line represent within the context of your graph? What does the y-intercept represent?
4.Test the residuals of two other points to determine how well the line of best fit models the data.
5. Use the line of best fit to help you to describe the data correlation.


Answers: 3
Other questions on the subject: Mathematics

Mathematics, 21.06.2019 18:30, singlegirlforlife541
Maria walks a round trip of 0.75 mile to school every day. how many miles will she walk in 4.5 days
Answers: 2


Mathematics, 21.06.2019 19:30, maribelarreolap4sgpj
Two corresponding sides of two similar triangles are 3cm and 5cm. the area of the first triangle is 12cm^2. what is the area of the second triangle?
Answers: 1

Mathematics, 21.06.2019 19:30, iicekingmann
Is the power produced directly proportional to the wind speed, give reasons for your answer?
Answers: 1
Do you know the correct answer?
Can somebody please help me? I will give brainliest
1. Which variable did you plot on the x-axis, a...
Questions in other subjects:


English, 23.09.2020 18:01


English, 23.09.2020 18:01


