

Mathematics, 04.02.2021 16:10, bookworm43
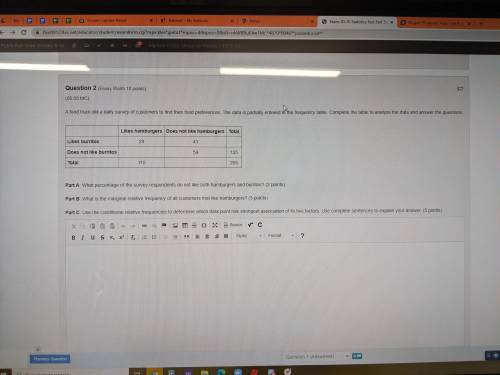
A food truck did a daily survey of customers to find their food preferences. The data is partially entered in the frequency table. Complete the table to analyze the data and answer the questions:
Likes hamburgers Does not like hamburgers Total
Likes burritos 29 41
Does not like burritos 54 135
Total 110 205
Part A: What percentage of the survey respondents do not like both hamburgers and burritos? (2 points)
Part B: What is the marginal relative frequency of all customers that like hamburgers? (3 points)
Part C: Use the conditional relative frequencies to determine which data point has strongest association of its two factors. Use complete sentences to explain your answer. (5 points)

Answers: 1


Other questions on the subject: Mathematics
Mathematics, 21.06.2019 13:00, reyesmtz5414
Select the correct answer from each drop down menu
Answers: 1
Mathematics, 21.06.2019 19:30, robert7248
I'm confused on this could anyone me and show me what i need to do to solve it.
Answers: 1
Mathematics, 21.06.2019 23:30, cornpops1749
Graph the line with the given slope m and y-intercept b. m=-3,b=1
Answers: 1
Do you know the correct answer?
A food truck did a daily survey of customers to find their food preferences. The data is partially e...
Questions in other subjects:
Mathematics, 12.02.2020 03:16


Mathematics, 12.02.2020 03:16

History, 12.02.2020 03:16


Chemistry, 12.02.2020 03:16


