

Mathematics, 04.02.2021 16:10, timithythaxton
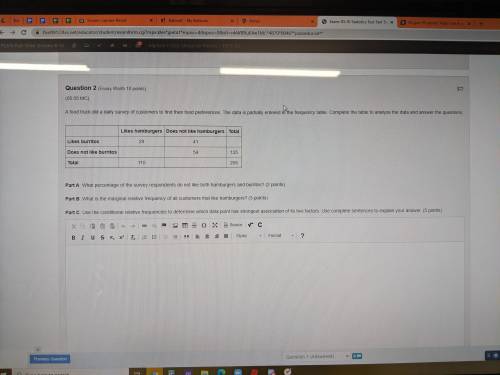
A food truck did a daily survey of customers to find their food preferences. The data is partially entered in the frequency table. Complete the table to analyze the data and answer the questions:
Likes hamburgers Does not like hamburgers Total
Likes burritos 29 41
Does not like burritos 54 135
Total 110 205
Part A: What percentage of the survey respondents do not like both hamburgers and burritos? (2 points)
Part B: What is the marginal relative frequency of all customers that like hamburgers? (3 points)
Part C: Use the conditional relative frequencies to determine which data point has strongest association of its two factors. Use complete sentences to explain your answer. (5 points)

Answers: 3


Other questions on the subject: Mathematics
Mathematics, 21.06.2019 15:30, makaylapink8167
The tiles below are pieces of a normal ecg tracing representing a little less than two heartbeats at a resting rate of 80 bpm. arrange the tiles in their correct order. rank from first to last. do not overlap any tiles.
Answers: 1
Do you know the correct answer?
A food truck did a daily survey of customers to find their food preferences. The data is partially e...
Questions in other subjects:
Mathematics, 14.12.2020 21:20


Mathematics, 14.12.2020 21:20


