

Mathematics, 03.02.2021 22:00, TombRaider167
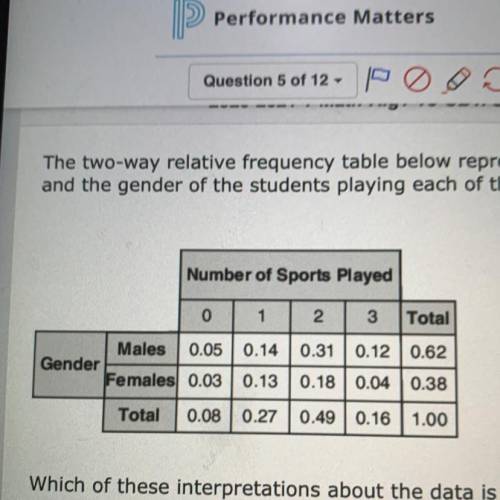
The two-way relative frequency table below represents the relationship between the number of sports played and the gender of the students playing each of these sports at a high school.
Which of these interpretations about the data is NOT correct?
7.89% of females do not play any sport.
8% of the students do not play any sport:
50% of the males play exactly two sports.
5% of the students who play no sports are male.

Answers: 3


Other questions on the subject: Mathematics
Mathematics, 22.06.2019 01:00, mdegracia73
The actual length of side t is 0.045cm. use the scale drawing to find the actual side length of w
Answers: 1
Do you know the correct answer?
The two-way relative frequency table below represents the relationship between the number of sports...
Questions in other subjects:


