


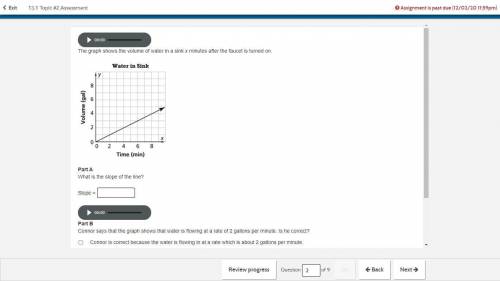
The graph shows the volume of water in a sink x minutes after the faucet is turned on.
Part A
...

Mathematics, 03.02.2021 02:30, Ecosey123
The graph shows the volume of water in a sink x minutes after the faucet is turned on.
Part A
What is the slope of the line?
Slope =
Part B
Connor says that the graph shows that water is flowing at a rate of 2 gallons per minute. Is he correct?
Connor is correct because the water is flowing in at a rate which is about 2 gallons per minute.
Connor is not correct because the water is flowing in at a rate which is faster than 2 gallons per minute.
Connor is not correct because the water is flowing in at a rate which is slower than 2 gallons per minute.
Connor is correct because the rate of water flowing is less than the slope.

Answers: 1
Other questions on the subject: Mathematics
Mathematics, 21.06.2019 14:30, paulinahunl17
The minimum wage in washington has been increasing over the last ten years. years 2000 2001 2002 2003 2004 2005 2006 2007 2008 2009 2010 washington state minimum wage $6.50 $6.72 $6.90 $7.01 $7.16 $7.35 $7.63 $7.93 $8.07 $8.55 $8.55 a) find the linear regression equation for the minimum wage in washington using this data ( x 0 in 2000). round to the thousandths. b) what is the slope? specifically, what does the slope represent in the real world context? c) what is the y-intercept? specifically, what does the y-intercept represent in the real world context? d) write your equation as a function of x. e) if you do not earn a college degree and you are earning minimum wage in 2020, what do you predict you will be earning per hour with the linear regression equation? f) if the trend continues, when will the minimum wage be $15 an hour? 3. why are your answers to #1d and #2a above different? which do you think is more accurate (#1 or #2) and why
Answers: 1
Mathematics, 21.06.2019 15:30, makaylapink8167
The tiles below are pieces of a normal ecg tracing representing a little less than two heartbeats at a resting rate of 80 bpm. arrange the tiles in their correct order. rank from first to last. do not overlap any tiles.
Answers: 1
Mathematics, 21.06.2019 17:10, Andrewecolt1993
Which is a graph of a proportional relationship?
Answers: 1
Mathematics, 21.06.2019 22:30, pedroramirezr2
What is the graph of the absolute value equation ? y=|x|-5
Answers: 1
Do you know the correct answer?
Questions in other subjects:
Mathematics, 25.02.2020 18:39


History, 25.02.2020 18:39
English, 25.02.2020 18:39

History, 25.02.2020 18:39


