


2
Question 1 (Essay Worth 10 points)
(06.01 MC)
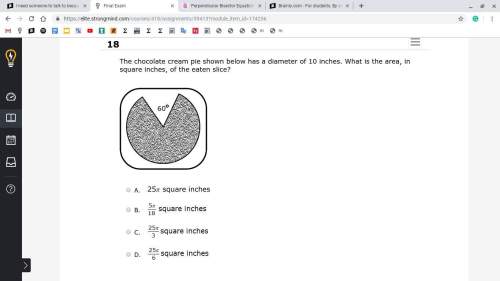
The scatter plot shows the relationship...

Mathematics, 03.02.2021 01:00, cheatcodeb
2
Question 1 (Essay Worth 10 points)
(06.01 MC)
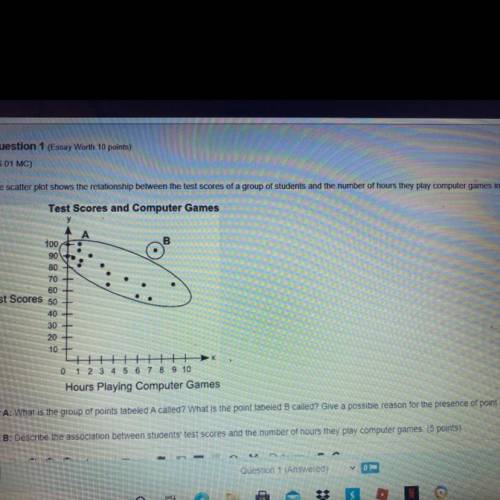
The scatter plot shows the relationship between the test scores of a group of students and the number of hours they play computer games in a week
Test Scores and Computer Games
100
90
80
70
60
Test Scores 50
40 +
30 +
20
10+
HHA
0 1 2 3 4 5 6 7 8 9 10
Hours Playing Computer Games
Part A: What is the group of points labeled A called? What is the point labeled B called? Give a possible reason for the presence of point B. (5 points)
Part B: Describe the association between students' test scores and the number of hours they play computer games. (5 points)

Answers: 1
Other questions on the subject: Mathematics
Mathematics, 21.06.2019 14:30, Harini5721
The expression 6x2 gives the surface area of a cube, and the expression x3 gives the volume of a cube, where x is the length of one side of the cube. find the surface area and the volume of a cube with a side length of 6m
Answers: 3
Mathematics, 21.06.2019 19:00, gabbytopper8373
Identify the type of observational study described. a statistical analyst obtains data about ankle injuries by examining a hospital's records from the past 3 years. cross-sectional retrospective prospective
Answers: 2
Mathematics, 21.06.2019 20:20, jackiediaz
One of every 20 customers reports poor customer service on your company’s customer satisfaction survey. you have just created a new process that should cut the number of poor customer service complaints in half. what percentage of customers would you expect to report poor service after this process is implemented? 1.) 5% 2.) 10% 3.) 2% 4.) 2.5%
Answers: 1
Do you know the correct answer?
Questions in other subjects:


Social Studies, 31.07.2019 09:40
Biology, 31.07.2019 09:40

Social Studies, 31.07.2019 09:40


