

Mathematics, 02.02.2021 19:40, IkarosSakurai
The graph shown is a scatter plot:
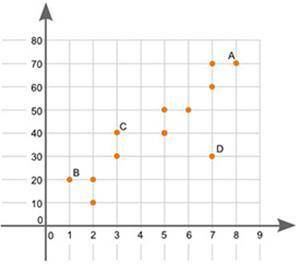
A scatter plot is shown with the values on the x-axis in increasing units of 1 and the y-axis in increasing units of 10. The data moves in an upward cluster.
Point A has coordinates 8 and 70.
Point B has coordinates 1 and 20,
point C has coordinates 3 and 40,
point D has coordinates 7 and 30.
Additional points are located at 2 and 10, 2 and 20, 3 and 30, 5 and 50, 5 and 40, 7 and 70, 7 and 60.
Which point on the scatter plot is an outlier? (4 points)
a
Point A
b
Point B
c
Point C
d
Point D

Answers: 1


Other questions on the subject: Mathematics
Mathematics, 21.06.2019 14:20, bbbbbbbbbbbb62
Triangle abc is reflected over the line y=x triangle abc has points (-6,-,-1) and (-5,-6) what is the c coordinate
Answers: 1
Mathematics, 21.06.2019 18:00, ineedhelp2285
Yesterday i ran 5 miles. today, i ran 3.7 miles. did my percent increase, decrease or is it a percent error? plz i need
Answers: 2
Do you know the correct answer?
The graph shown is a scatter plot:
A scatter plot is shown with the values on the x-axis in increas...
Questions in other subjects:

History, 16.07.2019 16:00

Mathematics, 16.07.2019 16:00
English, 16.07.2019 16:00
English, 16.07.2019 16:00
Mathematics, 16.07.2019 16:00


