Mathematics, 02.02.2021 19:10, lmimms02
Analyzing Bivariate Data
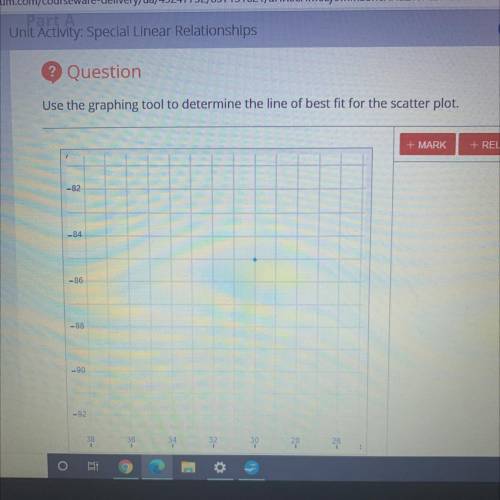
In this activity, you will draw a scatter plot and the line of best fit to analyze a situation.
Jeremy is on the planning committee for the rock climbing club. He is putting together a trip where members
can go outdoor rock climbing. He is trying to determine how high the group should climb and how long the
trip should last. He calls multiple parks in the area that offer rock climbing and collects data on the height of
the rock formations and the average time it takes people to reach the top and come back down. The data he
found is shown.
Time to Climb (min)
30
Height (ft)
85
45
120
115
298
87
194
160
434
60
241
135
351
117
339
55
180
145
400
95
24R


Answers: 1
Other questions on the subject: Mathematics


Mathematics, 21.06.2019 23:40, hardwick744
Typically a point in a three dimensional cartesian coordinate system is represented by which of the following answers in the picture !
Answers: 1

Mathematics, 22.06.2019 02:00, andrewblack033
Write the component forms of vectors u and v, shown in the graph, and find v − 2u. u= (< -3, -2> , < -3, -1> , < -2, -2> , < -2, -1> ) v= (< -5, 1> , -4, 0> , < 0, -4> , < 1, -5> ) v-2u= (< 5, 3> , < 0, 4> , < 4, 0> , < 5, -3>
Answers: 3
Do you know the correct answer?
Analyzing Bivariate Data
In this activity, you will draw a scatter plot and the line of best fit to...
Questions in other subjects:


Mathematics, 14.01.2021 02:10

English, 14.01.2021 02:10


English, 14.01.2021 02:10

History, 14.01.2021 02:10


