


Question 3
20 pts
This graph represents the relationship between the number of hours a babysi...

Mathematics, 01.02.2021 17:50, misspicafunpoke
Question 3
20 pts
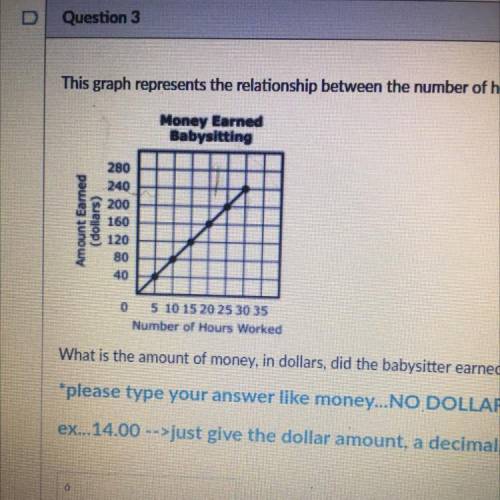
This graph represents the relationship between the number of hours a babysitter worked and the amount of money, in dollars, she earned.
Money Earned
Babysitting
Amount Earned
(dollars)
280
240
200
160
120
80
40
0
5 10 15 20 25 30 35
Number of Hours Worked
What is the amount of money, in dollars, did the babysitter earned for each hour she worked?
*please type your answer like money...NO DOLLAR SIGN...NO SPACES
ex... 14.00 -->just give the dollar amount, a decimal, and the change amount

Answers: 3
Other questions on the subject: Mathematics
Mathematics, 21.06.2019 19:30, ginocousins06
Fa bus driver leaves her first stop by 7: 00 a. m., her route will take less than 37 minutes. if she leaves after 7: 00 a. m., she estimates that the same route will take no less than 42 minutes. which inequality represents the time it takes to drive the route, r?
Answers: 3
Mathematics, 21.06.2019 19:50, jlankford148
A3-dimensional figure has a square base and 4 lateral faces that meet at a point. explain the difference between the cross sections when a slice is made perpendicular to the base through the vertex, and when a slice is made perpendicular to the base and not through the vertex
Answers: 2
Mathematics, 21.06.2019 20:30, extasisjorge
Ming says that 0.24 > 1/4 because 0.24= 2/4. which best explains mings error
Answers: 1
Do you know the correct answer?
Questions in other subjects:


English, 17.08.2021 23:50

Biology, 17.08.2021 23:50

Biology, 17.08.2021 23:50


