

Mathematics, 29.01.2021 17:40, chem1014
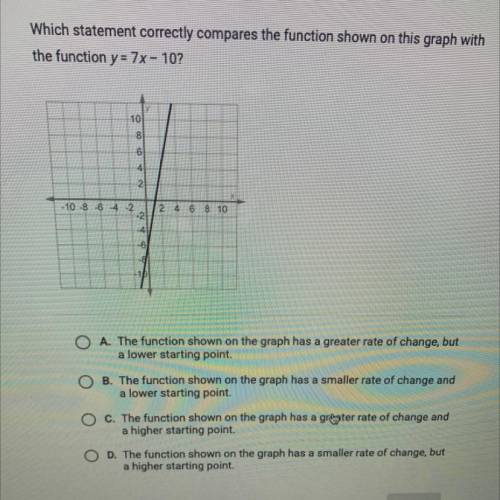
Which statement correctly compares the function shown on this graph with
the function y = 7x- 10?
10
8
No
-10-8-6-4-2
-2
2 4
6 8 10
-4
-6
O A. The function shown on the graph has a greater rate of change, but
a lower starting point.
B. The function shown on the graph has a smaller rate of change and
a lower starting point.
C. The function shown on the graph has a grhater rate of change and
a higher starting point.
D. The function shown on the graph has a smaller rate of change, but
a higher starting point.

Answers: 3


Other questions on the subject: Mathematics
Mathematics, 21.06.2019 14:10, evalentine843
Olivia uses the work below to determine 55% of 720 which explains the error in olivia’s solution
Answers: 1
Mathematics, 21.06.2019 20:20, bbyjoker
Recall that the owner of a local health food store recently started a new ad campaign to attract more business and wants to know if average daily sales have increased. historically average daily sales were approximately $2,700. the upper bound of the 95% range of likely sample means for this one-sided test is approximately $2,843.44. if the owner took a random sample of forty-five days and found that daily average sales were now $2,984, what can she conclude at the 95% confidence level?
Answers: 1
Mathematics, 21.06.2019 21:00, vrentadrienneoqug1a
Ian is in training for a national hot dog eating contest on the 4th of july. on his first day of training, he eats 4 hot dogs. each day, he plans to eat 110% of the number of hot dogs he ate the previous day. write an explicit formula that could be used to find the number of hot dogs ian will eat on any particular day.
Answers: 3
Do you know the correct answer?
Which statement correctly compares the function shown on this graph with
the function y = 7x- 10?
Questions in other subjects:


English, 29.06.2019 14:00

Mathematics, 29.06.2019 14:00

History, 29.06.2019 14:00

History, 29.06.2019 14:00


