

Mathematics, 29.01.2021 03:50, mandyO1
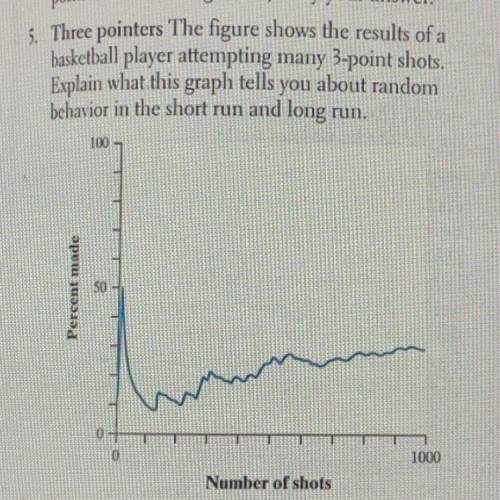
The figure shows the results of a basketball player attempting many 3-point shots. Explain what this graph tells you about random behavior in the short run and long run.

Answers: 3


Other questions on the subject: Mathematics
Mathematics, 21.06.2019 21:00, latinotimo7643
With both problems. a. s.a. p directions on photo ^
Answers: 1
Mathematics, 22.06.2019 00:00, keshjdjsjs
The graph shows the decibel measure for sounds depending on how many times as intense they are as the threshold of sound. noise in a quiet room is 500 times as intense as the threshold of sound. what is the decibel measurement for the quiet room? 20 decibels28 decibels200 decibels280 decibels
Answers: 1
Do you know the correct answer?
The figure shows the results of a basketball player attempting many 3-point shots. Explain what this...
Questions in other subjects:

Biology, 25.01.2022 02:50


Chemistry, 25.01.2022 02:50

Social Studies, 25.01.2022 02:50
Mathematics, 25.01.2022 02:50
Mathematics, 25.01.2022 02:50
Mathematics, 25.01.2022 02:50
Mathematics, 25.01.2022 02:50


