3-Jul-17
18-Jul-17
2-Aug-17
17-Aug-17
1-Sep-17
16-Sep-17
1-Oct-17
16-Oct-17
31-Oct-17
15-Nov-17
30-Nov-17
15-Dec-17
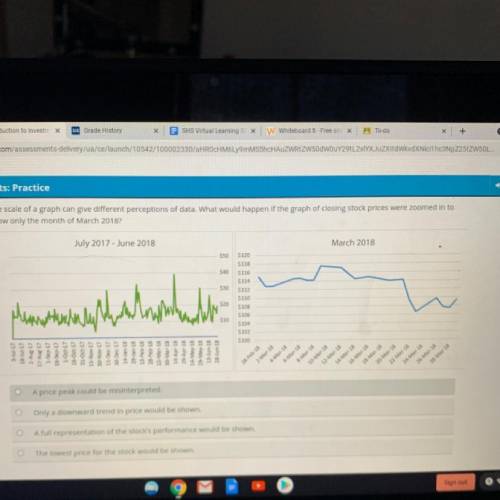
The lowest price for the stock would be shown
A full representation of the stock's performance would be shown.
A price peak could be misinterpreted.
Only a downward trend in price would be shown
July 2017 - June 2018
14-Jan-18
29-Jan-18
13-Feb-18
18-Feb-18
5-Mar-18
30-Mar-18
14-Apr-18
29-Apr-18
14-May-18
29-May-18
13-Jun-18
23-Jun-18
whole
$10
$20
$30
$40
$50
show only the month of March 2018?
The scale of a graph can give different perceptions of data. What would happen if the graph of closing stock prices were zoomed in to
$100
$102
S104
$106
S108
$110
$112
$114
$116
S118
S120
28-Feb-18
2-Mar-18
4-Mar-18
8- Mar 18
6-Mar-18
12. Ma
14.Mar. 18
10-Mar. 18
2-Mar 18
March 2018
16-Mar-18
18 Mar 18
20 Mar 18
22-Mar-18
24-Mar-18
26-Mar-18
28-Mar-18
Hassan bought a package of tofu. the temperature of the tofu was 14° celsius when hassan put the package into the freezer. he left the tofu in the freezer until it reached –19° celsius. which expressions explain how to find the change in temperature, in degrees celsius, of the package of tofu? select three that apply.