

Mathematics, 28.01.2021 22:00, richdakid26
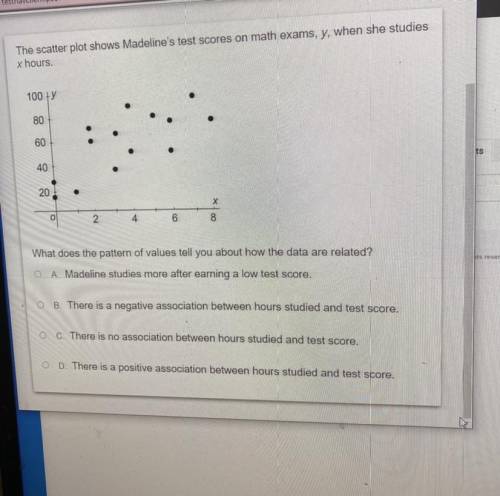
The scatter plot shows Madeline's test scores on math exams, y, when she studies x hours.
100+
80
60
40
20
o 이
2
х
8
4
6
What does the pattern of values tell you about how the data are related?
O A. Madeline studies more after earning a low test score.
OB. There is a negative association between hours studied and test score.
OC. There is no association between hours studied and test score.
OD. There is a positive association between hours studied and test score.

Answers: 3


Other questions on the subject: Mathematics
Mathematics, 21.06.2019 20:30, christian2510
Find the value of x. give reasons to justify your solutions! c ∈ ae
Answers: 1
Mathematics, 21.06.2019 22:30, minnahelhoor
How do i find the missing angle measure in a polygon
Answers: 1
Mathematics, 22.06.2019 01:30, michaela134
Aresearch study is done to find the average age of all u. s. factory workers. the researchers asked every factory worker in ohio what their birth year is. this research is an example of a census survey convenience sample simple random sample
Answers: 3
Mathematics, 22.06.2019 02:00, davidb1113
Mariano delivers newspaper. he always puts 3/4 of his weekly earnings in his savings account and then divides the rest equally into 3 piggy banks for spending at the snack shop, the arcade and the subway
Answers: 2
Do you know the correct answer?
The scatter plot shows Madeline's test scores on math exams, y, when she studies x hours.
100+
Questions in other subjects:


History, 16.10.2020 06:01

Geography, 16.10.2020 06:01


