

Mathematics, 28.01.2021 19:30, ennaturan
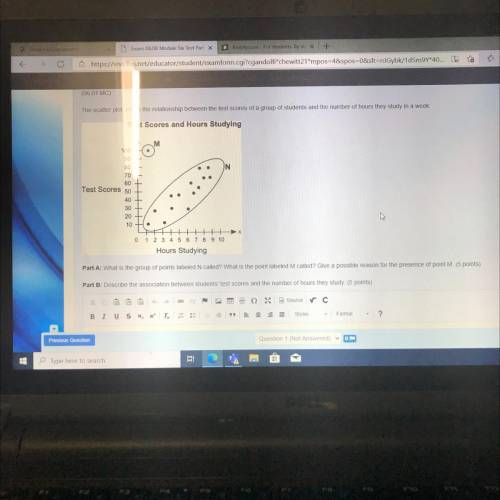
The scatter plot shows the relationship between the test scores of a group of students and the number of hours they study in a week
Test Scores and Hours Studying
Y У
A
100
90
80
70 +
60
Test Scores 50
40
30
20
10
0 1 2 3 4 5 6 7 8 9 10
Hours Studying
Part A: What is the group of points labeled N called? What is the point labeled Mcalled? Give a possible reason for the presence of point M. 5 points)
Part B: Describe the association between students test scores and the number of hours they study (5 points)

Answers: 1


Other questions on the subject: Mathematics
Mathematics, 21.06.2019 21:30, noelia2001guzman
Madeline takes her family on a boat ride. going through york canal, she drives 6 miles in 10 minutes. later on as she crosses stover lake, she drives 30 minutes at the same average speed. which statement about the distances is true?
Answers: 3
Do you know the correct answer?
The scatter plot shows the relationship between the test scores of a group of students and the numbe...
Questions in other subjects:

History, 21.10.2020 22:01
History, 21.10.2020 22:01

Mathematics, 21.10.2020 22:01
Mathematics, 21.10.2020 22:01


Arts, 21.10.2020 22:01


