


Which of the following is true of the interquartile range on a box plot?
A
It is drawn as two...

Mathematics, 27.01.2021 20:00, tanyalaurenti
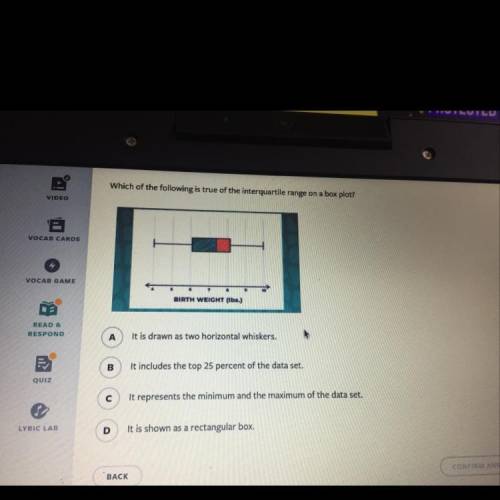
Which of the following is true of the interquartile range on a box plot?
A
It is drawn as two horizontal whiskers.
B
It includes the top 25 percent of the data set.
с
It represents the minimum and the maximum of the data set.
D
It is shown as a rectangular box.

Answers: 3
Other questions on the subject: Mathematics
Mathematics, 22.06.2019 01:00, lolhgb9526
Sanderson is having trouble with his assignment. his shown work is as follows: − 3 7 7 3 = − 3 7 × 7 3 = − 21 21 = −1 however, his answer does not match the answer that his teacher gives him. complete the description of sanderson's mistake. find the correct answer.
Answers: 3
Do you know the correct answer?
Questions in other subjects:
Mathematics, 14.11.2019 00:31

Mathematics, 14.11.2019 00:31

Biology, 14.11.2019 00:31


Chemistry, 14.11.2019 00:31


