

Mathematics, 26.01.2021 23:50, ltuthill
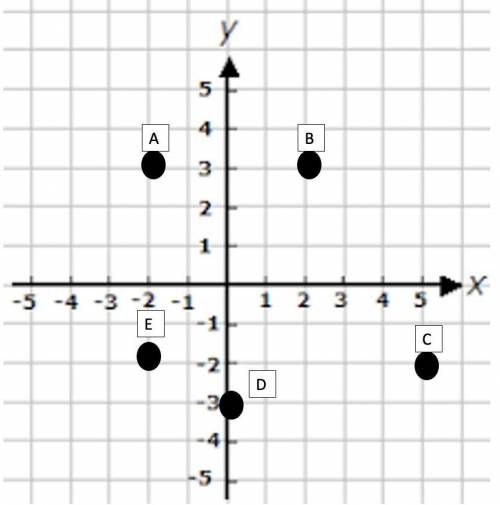
Figure ABCDE has vertices A(−2, 3), B(2, 3), C(5, −2), D(0, −3), and E(−2, −2). Plot the points on your own coordinate grid and connect the points in alphabetical order. Decompose Figure ABCDE into rectangles and triangles.
Part A: How many triangles and rectangles did you make? (1 point)
Part B: Use Figure ABCDE created on your coordinate grid to find the lengths, in units, of Sides AB and AE. (4 points)
Part C: What is the area of Figure ABCDE? Show your work. (5 points)
heres the picture:

Answers: 3


Other questions on the subject: Mathematics
Mathematics, 21.06.2019 19:40, marshallmattah
Suppose that 3% of all athletes are using the endurance-enhancing hormone epo (you should be able to simply compute the percentage of all athletes that are not using epo). for our purposes, a “positive” test result is one that indicates presence of epo in an athlete’s bloodstream. the probability of a positive result, given the presence of epo is .99. the probability of a negative result, when epo is not present, is .90. what is the probability that a randomly selected athlete tests positive for epo? 0.0297
Answers: 1
Mathematics, 21.06.2019 21:40, dededese2403
Astudy was interested in determining if eating milk chocolate lowered someone's cholesterol levels. ten people's cholesterol was measured. then, each of these individuals were told to eat 100g of milk chocolate every day and to eat as they normally did. after two weeks, their cholesterol levels were measured again. is there evidence to support that their cholesterol levels went down? how should we write the alternative hypothesis? (mud = the population mean difference= before - after)a. ha: mud = 0b. ha: mud > 0c. ha: mud < 0d. ha: mud does not equal 0
Answers: 1
Do you know the correct answer?
Figure ABCDE has vertices A(−2, 3), B(2, 3), C(5, −2), D(0, −3), and E(−2, −2). Plot the points on y...
Questions in other subjects:

Biology, 20.08.2020 01:01


Mathematics, 20.08.2020 01:01


