

Mathematics, 25.01.2021 23:30, heavyhearttim
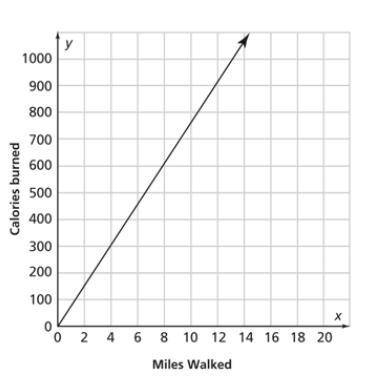
Lonnie walks for 30 minutes every day. The graph shows the number of Calories she burns in a week.
Which is true of the graph?
A. The graph has no y-intercept.
B. The graph of the line is y = 100x.
C. Miles walked and Calories burned are in a proportional relationship.
D. The more Lonnie walks the faster she goes.

Answers: 3


Other questions on the subject: Mathematics
Do you know the correct answer?
Lonnie walks for 30 minutes every day. The graph shows the number of Calories she burns in a week....
Questions in other subjects:

Biology, 22.09.2021 22:50

History, 22.09.2021 22:50


