9514 1404 393
see attached
Step-by-step explanation:
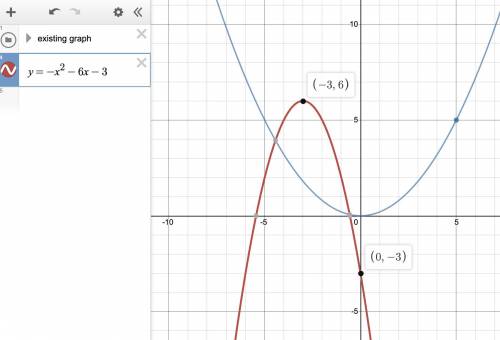
Sometimes the quadratic is easier to graph if written in vertex form.
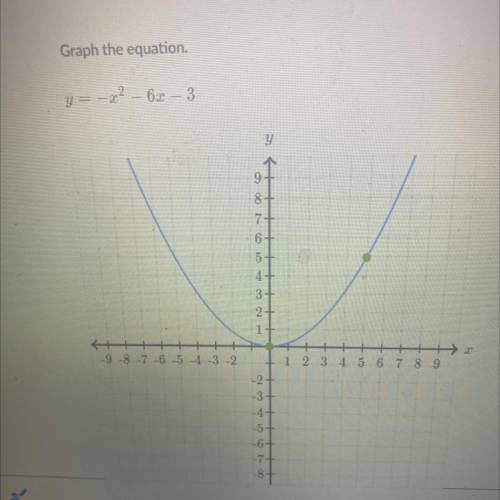
y = -x^2 -6x -3
= -(x^2 +6x) -3
= -(x^2 +6x +9) -3 +9
= -(x +3)^2 +6
This is a parabola that opens downward, with its vertex at (-3, 6). Unlike the one shown in the graph already, its scale factor is 1, so it will appear narrower than the one given with the problem statement.