

Mathematics, 25.01.2021 20:10, sophie5064
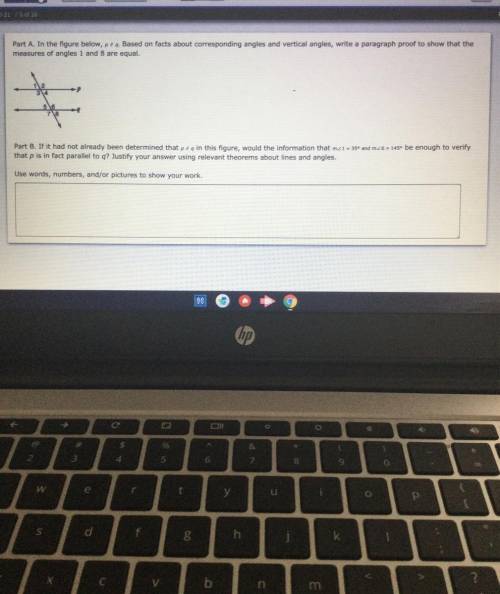
Part A. In the figure below, p. q. Based on facts about corresponding angles and vertical angles, write a paragraph proof to show that the
measures of angles 1 and 8 are equal.
-Р
Part B. If it had not already been determined that pain this figure, would the information that mzi - 35° and m26 - 145 be enough to verify
that p is in fact parallel to q? Justify your answer using relevant theorems about lines and angles.
Use words, numbers, and/or pictures to show your work

Answers: 1


Other questions on the subject: Mathematics
Mathematics, 21.06.2019 19:40, Candieboo4006
It appears that people who are mildly obese are less active than leaner people. one study looked at the average number of minutes per day that people spend standing or walking. among mildly obese people, the mean number of minutes of daily activity (standing or walking) is approximately normally distributed with mean 376 minutes and standard deviation 64 minutes. the mean number of minutes of daily activity for lean people is approximately normally distributed with mean 528 minutes and standard deviation 107 minutes. a researcher records the minutes of activity for an srs of 7 mildly obese people and an srs of 7 lean people. use z-scores rounded to two decimal places to answer the following: what is the probability (image for it appears that people who are mildly obese are less active than leaner people. one study looked at the averag0.0001) that the mean number of minutes of daily activity of the 6 mildly obese people exceeds 420 minutes? what is the probability (image for it appears that people who are mildly obese are less active than leaner people. one study looked at the averag0.0001) that the mean number of minutes of daily activity of the 6 lean people exceeds 420 minutes?
Answers: 1
Mathematics, 21.06.2019 20:00, naimareiad
Ialready asked this but i never got an answer. will give a high rating and perhaps brainliest. choose the linear inequality that describes the graph. the gray area represents the shaded region. y ≤ –4x – 2 y > –4x – 2 y ≥ –4x – 2 y < 4x – 2
Answers: 1
Mathematics, 21.06.2019 21:00, izaiahfieods
Bella want to know what the students at her school think of her show. which is the best group to survey to find this information a. go to the mall and ask all of the students she recognizes from school b. ask her viewers to call in durning an episode of the show c. get a list of students at her school from the office and use a random number generator to pick 30 of them d. get a list of students at her school from the office and pick the first 30 students on the list
Answers: 1
Mathematics, 21.06.2019 21:30, kristinashau
If you flip a coin 3 times, what is the probability of flipping heads 3 times? a. p(3 heads) = 3/8 b. p(3 heads) = 1/6 c. p(3 heads) = 1/8 d. p(3 heads) = 1/2
Answers: 2
Do you know the correct answer?
Part A. In the figure below, p. q. Based on facts about corresponding angles and vertical angles, wr...
Questions in other subjects:


Biology, 20.11.2020 22:10
Mathematics, 20.11.2020 22:10
Mathematics, 20.11.2020 22:10
Mathematics, 20.11.2020 22:10
Mathematics, 20.11.2020 22:10

Arts, 20.11.2020 22:10

Social Studies, 20.11.2020 22:10


