

Mathematics, 25.01.2021 20:00, anthonylemus36
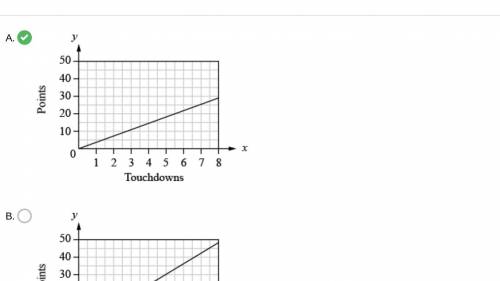
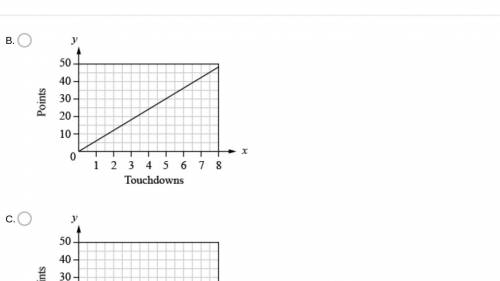
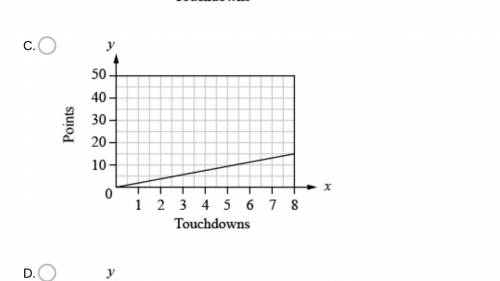
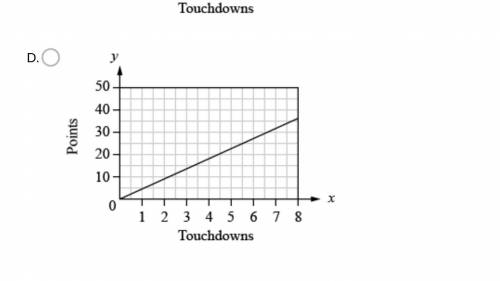
Which graph represents the proportional relationship of 6 points for each touchdown?

Answers: 3


Other questions on the subject: Mathematics
Mathematics, 21.06.2019 14:30, Molly05
Atoy company is considering a cube or sphere-shaped container for packaging a new product. the height of the cube would equal the diameter of the sphere . compare the volume to surface area ratios of the containers. which packaging will be more efficient? for a sphere, sa =4πr²
Answers: 1
Mathematics, 21.06.2019 19:00, morgeron6071
Which statement best explains why ben uses the width hi to create the arc at j from point k
Answers: 2
Do you know the correct answer?
Which graph represents the proportional relationship of 6 points for each touchdown?
Questions in other subjects:


Social Studies, 01.02.2021 08:30

Physics, 01.02.2021 08:30


