

Mathematics, 25.01.2021 17:30, luella614ox1zum
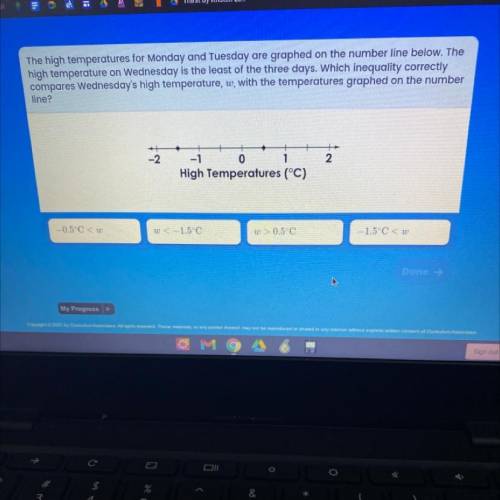
The high temperatures for Monday and Tuesday are graphed on the number line below. The
high temperature on Wednesday is the least of the three days. Which inequality correctly
compares Wednesday's high temperature, w, with the temperatures graphed on the number
line?
-2
2
-1
0
1
High Temperatures (°C)
-0.5°C
w < -1.5 C
w > 0.5°C
-1.5 0
I need help

Answers: 2


Other questions on the subject: Mathematics
Do you know the correct answer?
The high temperatures for Monday and Tuesday are graphed on the number line below. The
high tempera...
Questions in other subjects:

English, 27.05.2021 15:30

Chemistry, 27.05.2021 15:30

History, 27.05.2021 15:30
Mathematics, 27.05.2021 15:30
Mathematics, 27.05.2021 15:30
English, 27.05.2021 15:30


