


The table represents some points on the graph of a linear function.
х
y
-2
12
0...

Mathematics, 22.01.2021 23:30, baileyanne9389
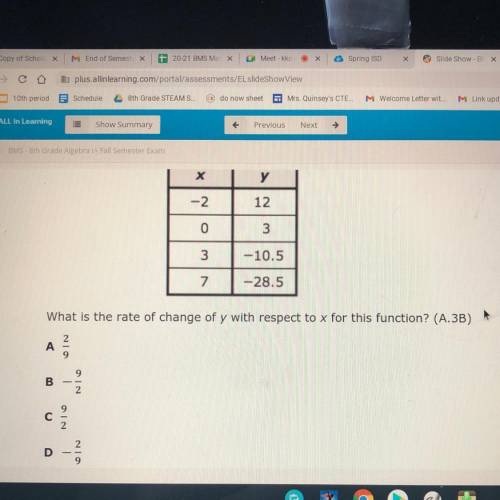
The table represents some points on the graph of a linear function.
х
y
-2
12
0
3
3
-10.5
7.
-28.5
What is the rate of change of y with respect to x for this function?

Answers: 2
Other questions on the subject: Mathematics
Mathematics, 22.06.2019 02:20, marandahuber
The diagram shows a cuboid abcdefgh abcd is a square with area 25cm². find the volume of the cuboid.
Answers: 3
Do you know the correct answer?
Questions in other subjects:


Social Studies, 28.05.2020 19:03

English, 28.05.2020 19:04
History, 28.05.2020 19:04
English, 28.05.2020 19:04

Chemistry, 28.05.2020 19:04


