


PROBLEM #3
A g(x) = 6(3)"
An exponential function is graphed on the
grid. Which functio...

Mathematics, 22.01.2021 23:10, tanashaw16
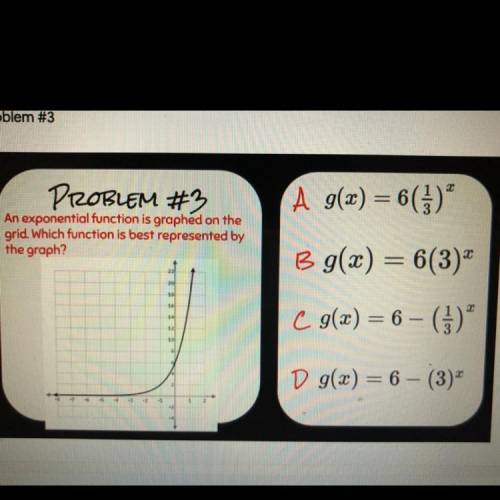
PROBLEM #3
A g(x) = 6(3)"
An exponential function is graphed on the
grid. Which function is best represented by
the graph?
B g(x) = 6(3)*
1
14
2
14
C g(x) = 6 - (3)
12
10
D g(x) = 6 - (3)
-6
--
-

Answers: 1
Other questions on the subject: Mathematics
Mathematics, 22.06.2019 01:30, Laners0219
Which represents the number of times all outcomes less than a given outcome occur? cumulative frequency relative frequency frequency cumulative relative frequency
Answers: 3
Mathematics, 22.06.2019 04:30, alexisss23
Television viewing reached a new high when the global information and measurement company reported a mean daily viewing time of 8.35 hours per household. use a normal probability distribution with a standard deviation of 2.5 hours to answer the following questions about daily television viewing per household. a. what is the probability that a household views television between 4 and 10 hours a day? (to 4 decimals) b. how many hours of television viewing must a household have in order to be in the top 7% of all television viewing household? (to 2 decimals) c. what is the probability that a household views television more than 4 hours a day? (to 4 decimals)
Answers: 1
Do you know the correct answer?
Questions in other subjects:


Mathematics, 02.03.2020 21:01


