


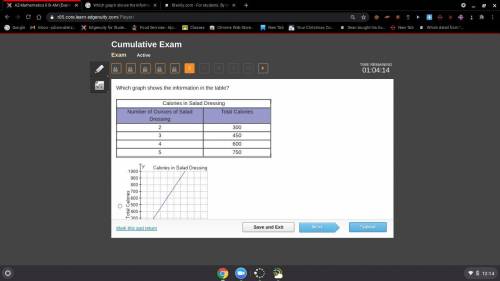
Which graph shows the information in the table?
Calories in Salad Dressing
Number of Ounces o...

Mathematics, 22.01.2021 22:30, teescub9738
Which graph shows the information in the table?
Calories in Salad Dressing
Number of Ounces of Salad Dressing
Total Calories
2
300
3
450
4
600
5
750
On a coordinate plane, the x-axis is labeled ounces of salad dressing and the y-axis is labeled Total calories. A line goes through points (2, 300) and (4, 600).
On a coordinate plane, the x-axis is labeled ounces of salad dressing and the y-axis is labeled Total calories. A line goes through points (300, 2) and (600, 4).
On a coordinate plane, the x-axis is labeled ounces of salad dressing and the y-axis is labeled Total calories. A line goes through points (1, 200) and (2, 300).
On a coordinate plane, the x-axis is labeled ounces of salad dressing and the y-axis is labeled Total calories. A line goes through points (200, 1) and (300, 2).

Answers: 1
Other questions on the subject: Mathematics
Mathematics, 21.06.2019 15:00, arias333
Solve the word problem. the table shows the low outside temperatures for monday, tuesday, and wednesday. by how many degrees did the low temperature increase from monday to tuesday? this function table shows the outside temperature for a given a. 21.1⁰ b. 8.6⁰ c. 4.9⁰ d. 3.9⁰(the picture is the graph the the question is talking about.)
Answers: 1
Mathematics, 21.06.2019 17:30, Misspaige5150
17 in long 1.3 ft wide and 8in high what is the volume
Answers: 1
Mathematics, 21.06.2019 18:30, Sruyle51230
Which value would be a solution for x in the inequality 47-4x< 7
Answers: 1
Do you know the correct answer?
Questions in other subjects:


English, 03.11.2020 16:30


