

Mathematics, 22.01.2021 18:10, meramera50
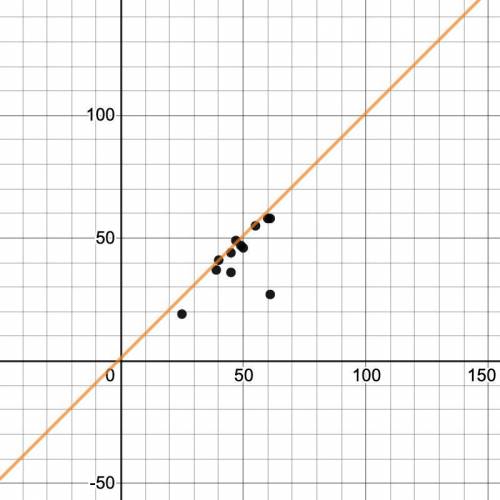
Part Three: The Line of Best Fit
Include your scatter plot and the answers to the following questions in your word processing document:
Which variable did you plot on the x-axis and which variable did you plot on the y-axis? Explain why you assigned the variables in that way.
Write the equation of the line of best fit using the slope-intercept formula y = mx + b. Show all your work, including the points used to determine the slope and how the equation was determined.
What does the slope of the line represent within the context of your graph? What does the y-intercept represent?
Test the residuals of two other points to determine how well the line of best fit models the data.
Use the line of best fit to help you to describe the data correlation.
Using the line of best fit that you found in Part Three, Question 2, approximate how tall is a person whose arm span is 66 inches?
According to your line of best fit, what is the arm span of a 74-inch-tall person?

Answers: 3


Other questions on the subject: Mathematics
Do you know the correct answer?
Part Three: The Line of Best Fit
Include your scatter plot and the answers to the following questio...
Questions in other subjects:
Mathematics, 12.12.2019 08:31
Mathematics, 12.12.2019 08:31
Mathematics, 12.12.2019 08:31

Health, 12.12.2019 08:31
Mathematics, 12.12.2019 08:31


