


The mean is
less than the median
COMPLETE
What type of data distribution is shown on th...

Mathematics, 22.01.2021 02:00, abaroudi
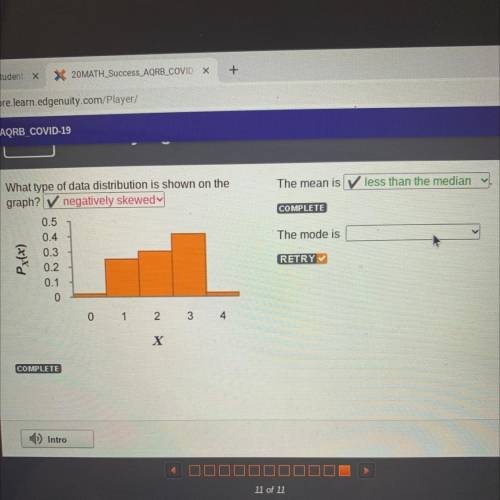
The mean is
less than the median
COMPLETE
What type of data distribution is shown on the
graph? V negatively skewedy
0.5
0.4
& 0.3
0.2
0.1
The mode is
DONE
ON
greater than the median
less than the median
0 1 2 3 4
equal to the median
COMPLETE

Answers: 3
Other questions on the subject: Mathematics
Mathematics, 21.06.2019 13:00, OsoDeOro7968
Carter drank 15.75 gallons of water in 4 weeks. he drank the same amount of water each day. a. estimate how many gallons he drank in one day. b. estimate how many gallons he drank in one week. c. about how many days altogether will it take him to drink 20 gallons?
Answers: 1
Mathematics, 21.06.2019 18:00, carnations
Does anyone know how to do geometryme with this problem
Answers: 1
Mathematics, 21.06.2019 20:00, gordon57
Someone answer asap for ! max recorded the heights of 500 male humans. he found that the heights were normally distributed around a mean of 177 centimeters. which statements about max’s data must be true? a. the median of max’s data is 250 b. more than half of the data points max recorded were 177 centimeters. c. a data point chosen at random is as likely to be above the mean as it is to be below the mean. d. every height within three standard deviations of the mean is equally likely to be chosen if a data point is selected at random.
Answers: 1
Do you know the correct answer?
Questions in other subjects:


