

Mathematics, 21.01.2021 17:10, grantjaylynn
NEED HELP ASAP PLEASE
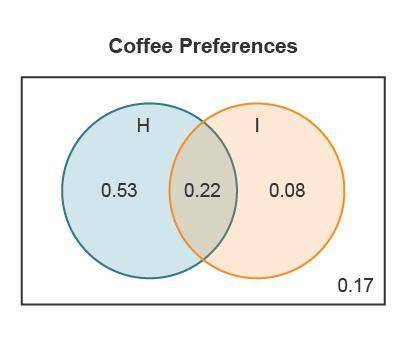
According to sales records at a local coffee shop, 75% of all customers like hot coffee, 30% like iced coffee, and 22% like both hot and iced coffee. The Venn diagram displays the coffee preferences of the customers.
A Venn Diagram titled Coffee Preferences. One circle is labeled H, 0.53, the other circle is labeled I, 0.08, the shared area is labeled 0.22, and the outside area is labeled 0.17.
A randomly selected customer is asked if they like hot or iced coffee. Let H be the event that the customer likes hot coffee and let I be the event that the customer likes iced coffee. What is the probability that the customer only likes iced coffee?
0.08
0.17
0.22
0.53

Answers: 1


Other questions on the subject: Mathematics
Mathematics, 21.06.2019 16:00, blackwhiteroses383
Which graph represents the solution set for the given system of inequalities? x+2y< 3 x+y> 4 3x-2y> 4
Answers: 2
Mathematics, 21.06.2019 19:30, anthonyfr10004
Which describes the difference between the graph of f(x)=x^2 and g(x)=-(x^2-2)
Answers: 1
Mathematics, 21.06.2019 23:30, xandraeden32
Consider the first four terms of the sequence below. what is the 8th term of this sequence?
Answers: 1
Do you know the correct answer?
NEED HELP ASAP PLEASE
According to sales records at a local coffee shop, 75% of all customers like...
Questions in other subjects:
Mathematics, 29.04.2021 21:20

Mathematics, 29.04.2021 21:20
Mathematics, 29.04.2021 21:20

Mathematics, 29.04.2021 21:20
Mathematics, 29.04.2021 21:20

Mathematics, 29.04.2021 21:20


