

Mathematics, 21.01.2021 08:50, groweisa
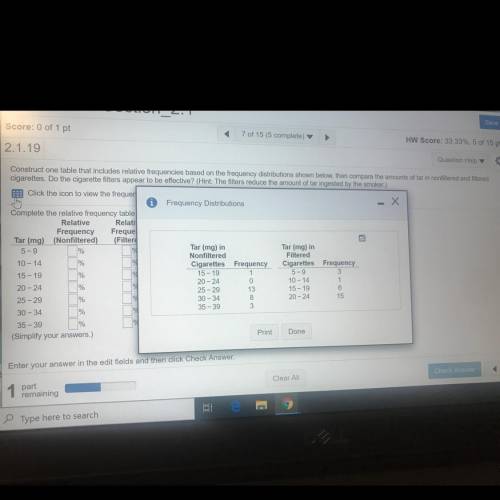
Construct one table that includes relative frequencies based on the frequency distributions shown below, then compare the amounts of tar in nonfiltered and filtered
cigarettes. Do the cigarette filters appear to be effective? (Hint: The filters reduce the amount of tar ingested by the smoker.)
Click the icon to view the frequency distributions.
Complete the relative frequency table below.
Relative Relative
Frequency Frequency
Tar (mg) (Nonfiltered) (Filtered)
5-9
%
%
15 - 19
20 - 24
%
25 - 29
30-34
35-39
(Simplify your answers.)
10 - 14
%

Answers: 3


Other questions on the subject: Mathematics
Do you know the correct answer?
Construct one table that includes relative frequencies based on the frequency distributions shown be...
Questions in other subjects:
Mathematics, 30.08.2019 02:10
Mathematics, 30.08.2019 02:10


Chemistry, 30.08.2019 02:10


