

Mathematics, 20.01.2021 21:20, rex1578
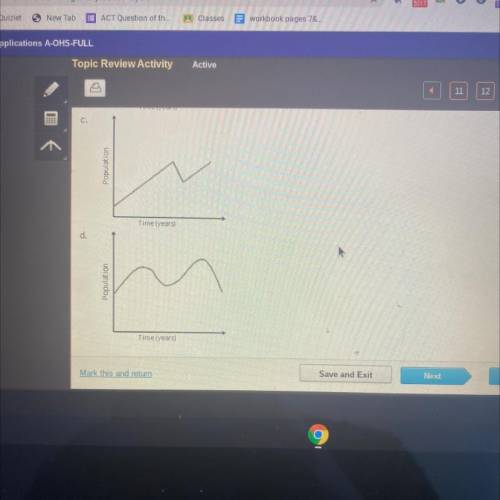
The population of fish in a pond in relation to the number of years since stocking is depicted on a graph. For the first few
years after the pond is stocked, the population grows slowly. It increases more quickly as the fish reproduce, then it
levels off. A pollutant kills off almost all of the fish 20 years after stocking. The population begins to grow again when the
remaining fish reproduce. Which graph depicts the situation described above?
а.
Population
Timely ears)
b.
opulation

Answers: 2


Other questions on the subject: Mathematics
Mathematics, 21.06.2019 20:00, soniah
Pepe and leo deposits money into their savings account at the end of the month the table shows the account balances. if there pattern of savings continue and neither earns interest nor withdraw any of the money , how will the balance compare after a very long time ?
Answers: 1
Mathematics, 22.06.2019 01:20, katherinevandehei
Construct a box plot to represent the ages of the actors in a play. step 1: arrange the numbers in order from lowest (on the left) to highest. 24 18 30 26 24 33 32 44 25 28
Answers: 3
Mathematics, 22.06.2019 07:30, bfgnnnbddf6830
Mikael, hema and 5 friends will run an event. they will wear either a red shirt or red baseball hat during the event. they want to spend exactley $40. shirts cost $8 each and caps cost $4 each.
Answers: 2
Do you know the correct answer?
The population of fish in a pond in relation to the number of years since stocking is depicted on a...
Questions in other subjects:

Chemistry, 13.11.2019 21:31
Mathematics, 13.11.2019 21:31

Mathematics, 13.11.2019 21:31


English, 13.11.2019 21:31


