

Mathematics, 20.01.2021 20:50, MacieKay8865
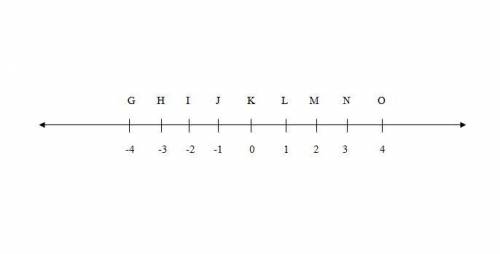
What is HJ + JM? The number line from minus four to four by increment of one and each tick mark is labeled. In this number line point minus four is also labeled as G, minus three is labeled as H, minus two is labeled as I, minus one is labeled as J, zero is labeled as K, one is labeled as L, two is labeled as M, three is labeled as N, and four is labeled as O.

Answers: 2


Other questions on the subject: Mathematics
Mathematics, 21.06.2019 21:30, Caixiayang3613
Look at the figure below: triangle abc is a right triangle with angle abc equal to 90 degrees. the length of ac is 5 units and the length of ab is 4 units. d is a point above c. triangle adc is a right triangle with angle dac equal to 90 degrees and dc parallel to ab. what is the length, in units, of segment cd?
Answers: 1
Mathematics, 21.06.2019 23:30, olivialaine31
Will give brainliest for correct answer 8. use the distance time graph to answer these questions: a. what does the graph tell us about the velocity of the car? b. what is the average velocity of the car? (show work) c. is the velocity reflected in the graph positive or negative?d. is there any point on the graph where the car is not moving? how do we know?
Answers: 1
Mathematics, 22.06.2019 03:00, dominiqueallen23
Describe how the presence of possible outliers might be identified on the following. (a) histograms gap between the first bar and the rest of bars or between the last bar and the rest of bars large group of bars to the left or right of a gap higher center bar than surrounding bars gap around the center of the histogram higher far left or right bar than surrounding bars (b) dotplots large gap around the center of the data large gap between data on the far left side or the far right side and the rest of the data large groups of data to the left or right of a gap large group of data in the center of the dotplot large group of data on the left or right of the dotplot (c) stem-and-leaf displays several empty stems in the center of the stem-and-leaf display large group of data in stems on one of the far sides of the stem-and-leaf display large group of data near a gap several empty stems after stem including the lowest values or before stem including the highest values large group of data in the center stems (d) box-and-whisker plots data within the fences placed at q1 â’ 1.5(iqr) and at q3 + 1.5(iqr) data beyond the fences placed at q1 â’ 2(iqr) and at q3 + 2(iqr) data within the fences placed at q1 â’ 2(iqr) and at q3 + 2(iqr) data beyond the fences placed at q1 â’ 1.5(iqr) and at q3 + 1.5(iqr) data beyond the fences placed at q1 â’ 1(iqr) and at q3 + 1(iqr)
Answers: 1
Do you know the correct answer?
What is HJ + JM?
The number line from minus four to four by increment of one and each tick mark is...
Questions in other subjects:

Geography, 20.02.2021 05:10

World Languages, 20.02.2021 05:10
Mathematics, 20.02.2021 05:10
Mathematics, 20.02.2021 05:10


History, 20.02.2021 05:10


